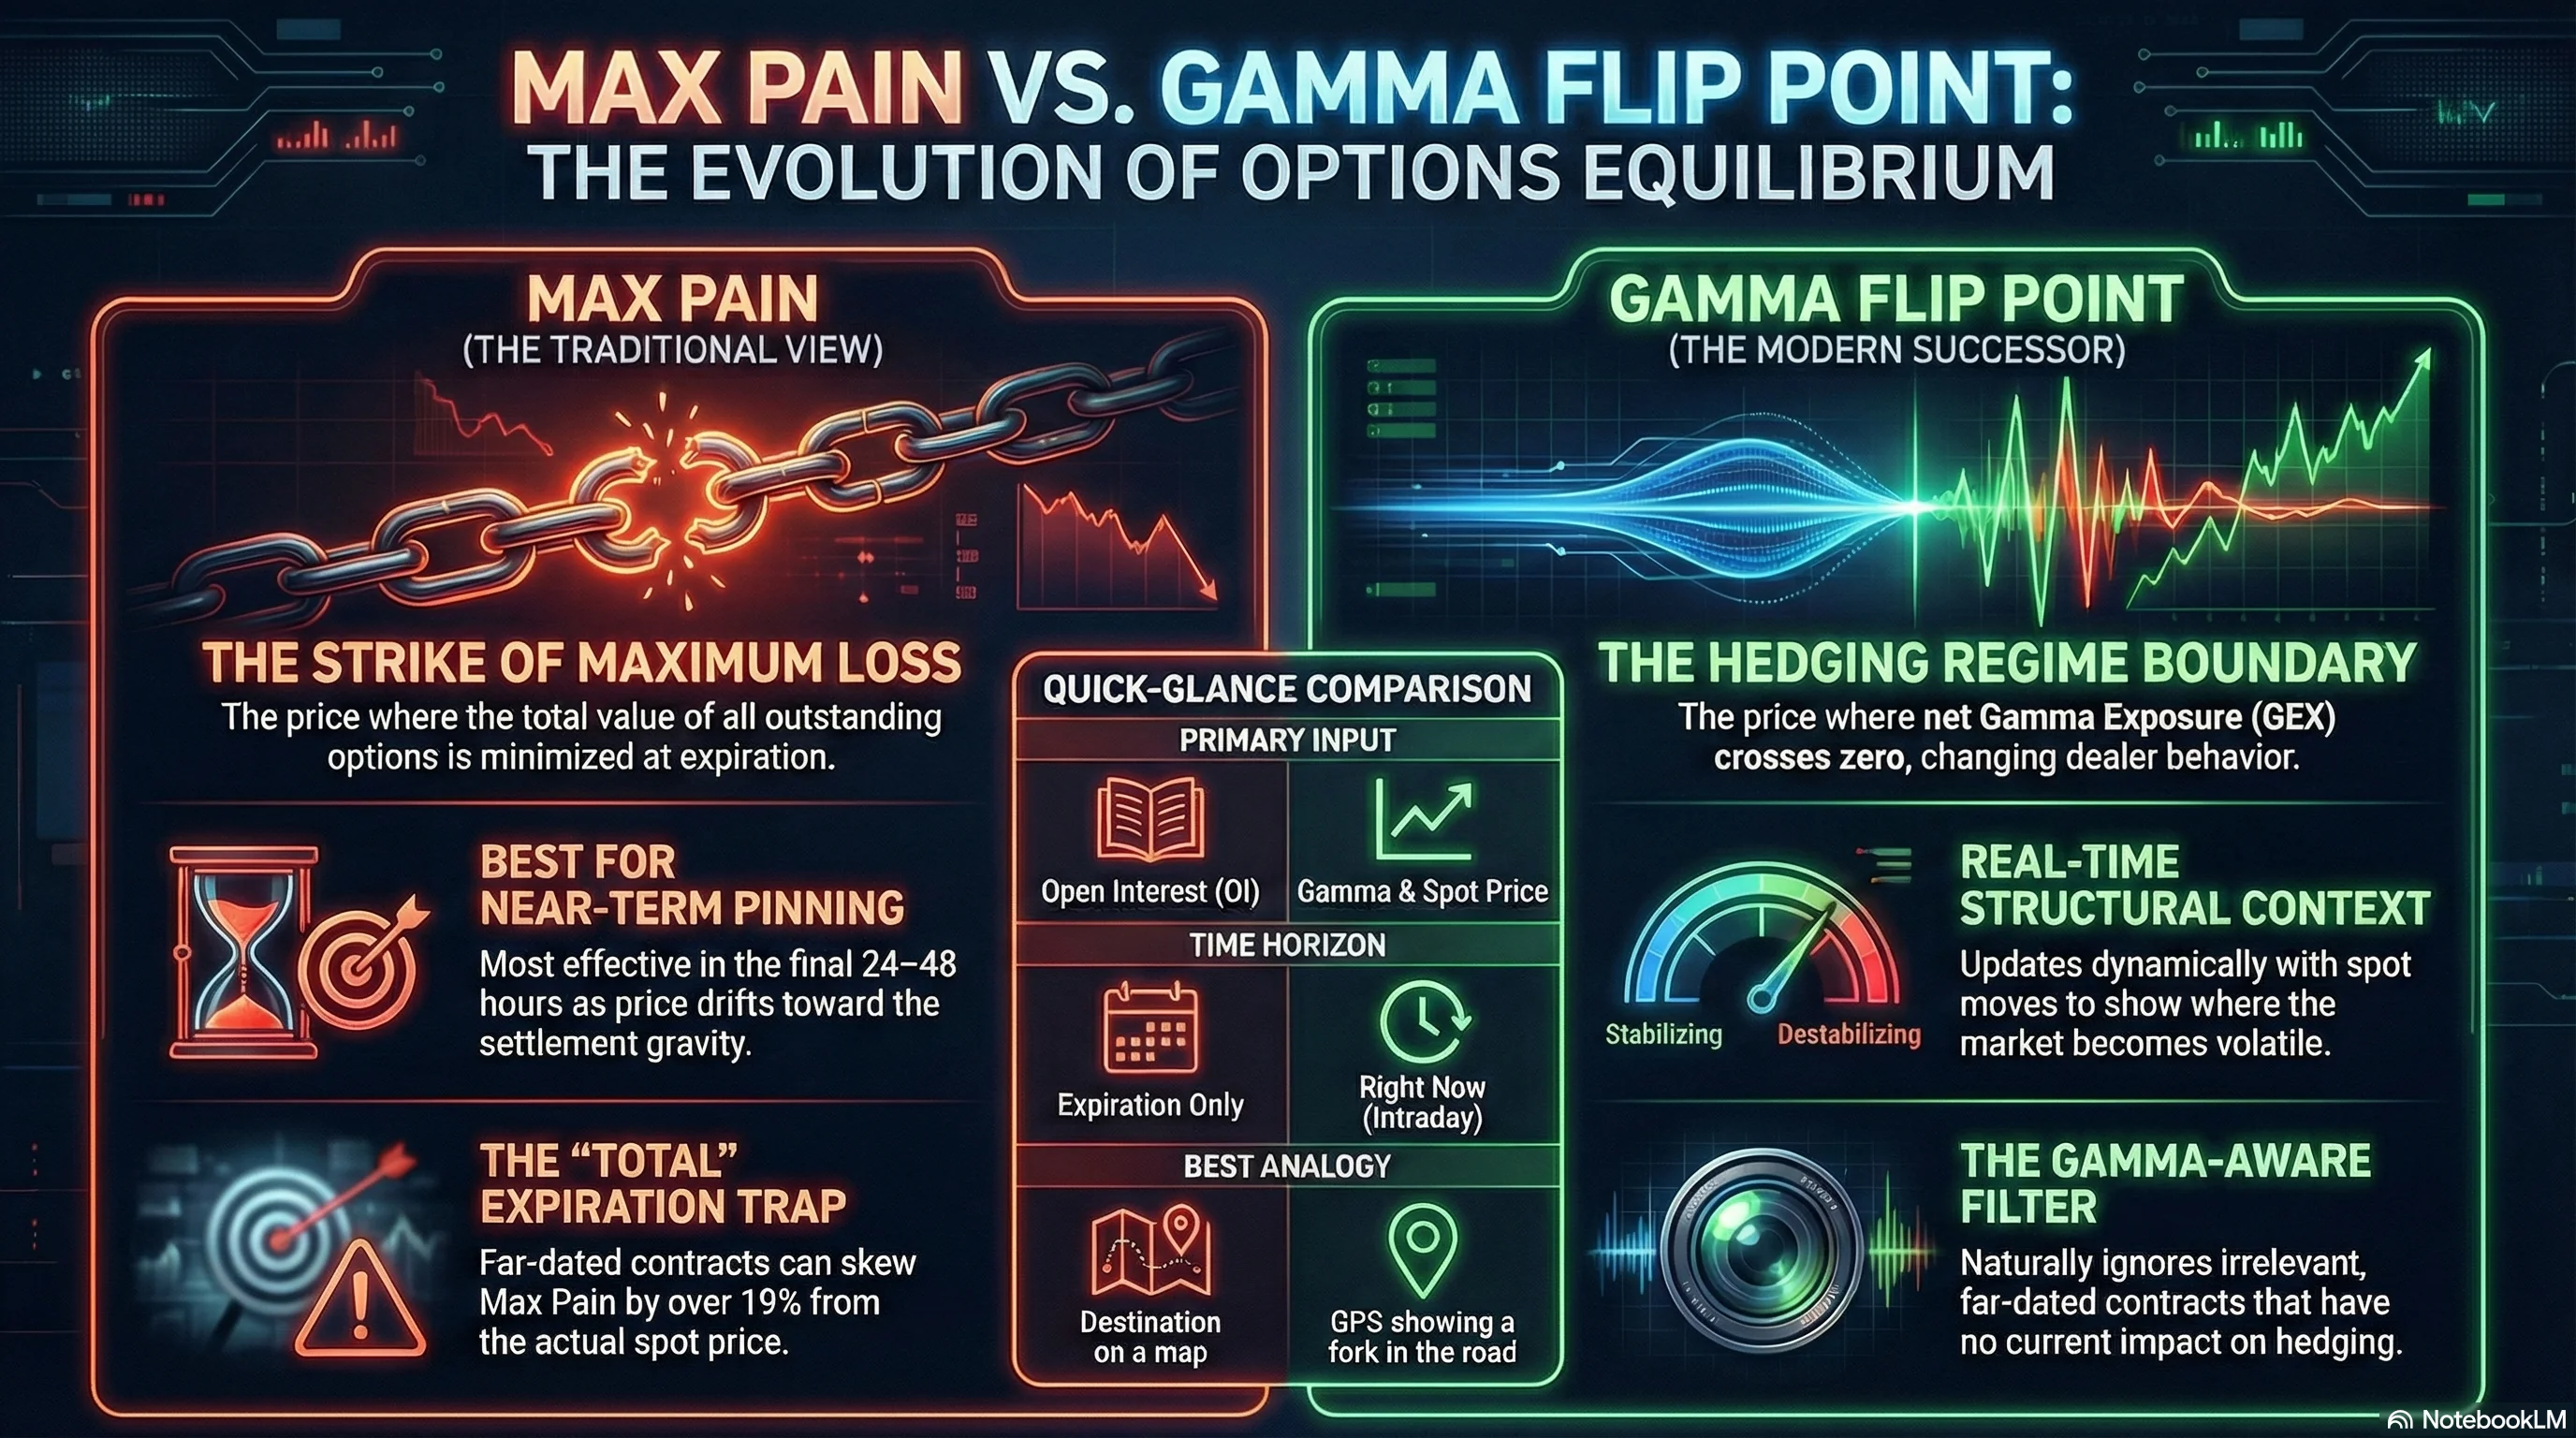
Max Pain Explained: The Options Gravity — and Why Gamma Rewrites It
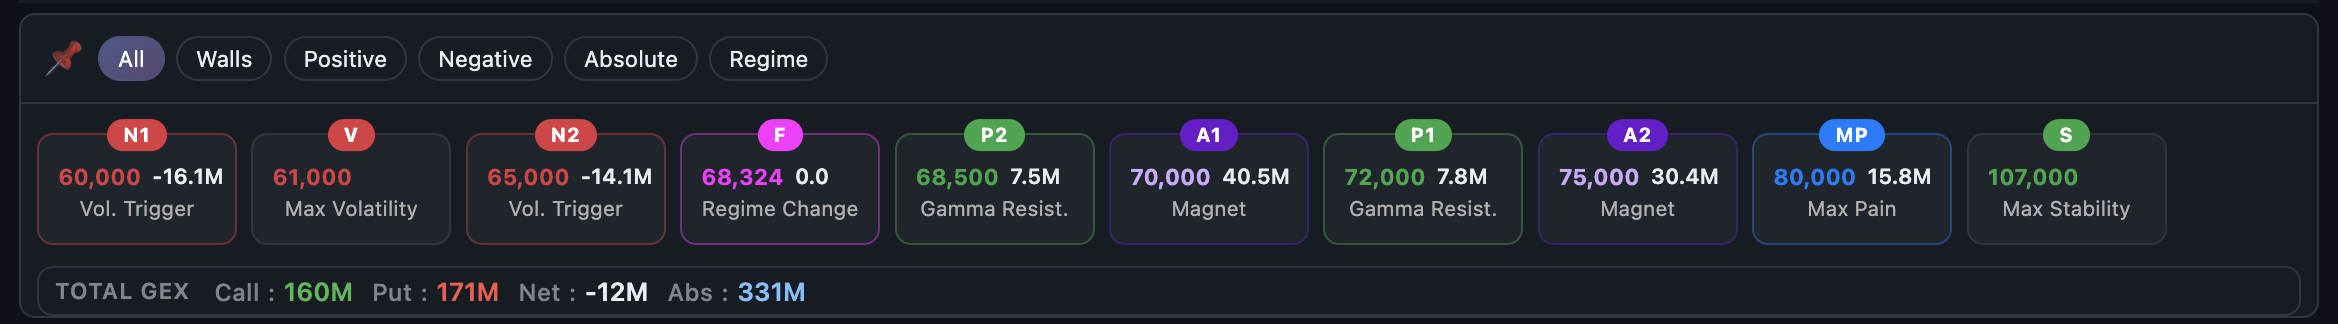
What is Max Pain, how does it work, and where does it fall short? A practical guide to the oldest options equilibrium metric — and why the Gamma Flip Point is its modern, real-time successor.
Read Article