What GEX tells you
Read the GEX-by-Strike chart as a map of net dealer hedging exposure.
You now know what gamma is, how dealers hedge, and why they have to keep updating those hedges. The GEX chart is the part that turns all of that into a map.
The construction
Each bar on the GEX-by-Strike chart represents a single strike price. To compute the bar's height:
- Take every option contract at that strike — calls and puts, all expirations in your filter.
- For each contract: gamma × open interest × dealer's position sign.
- Sum it up.
That sum is what shows on the chart.
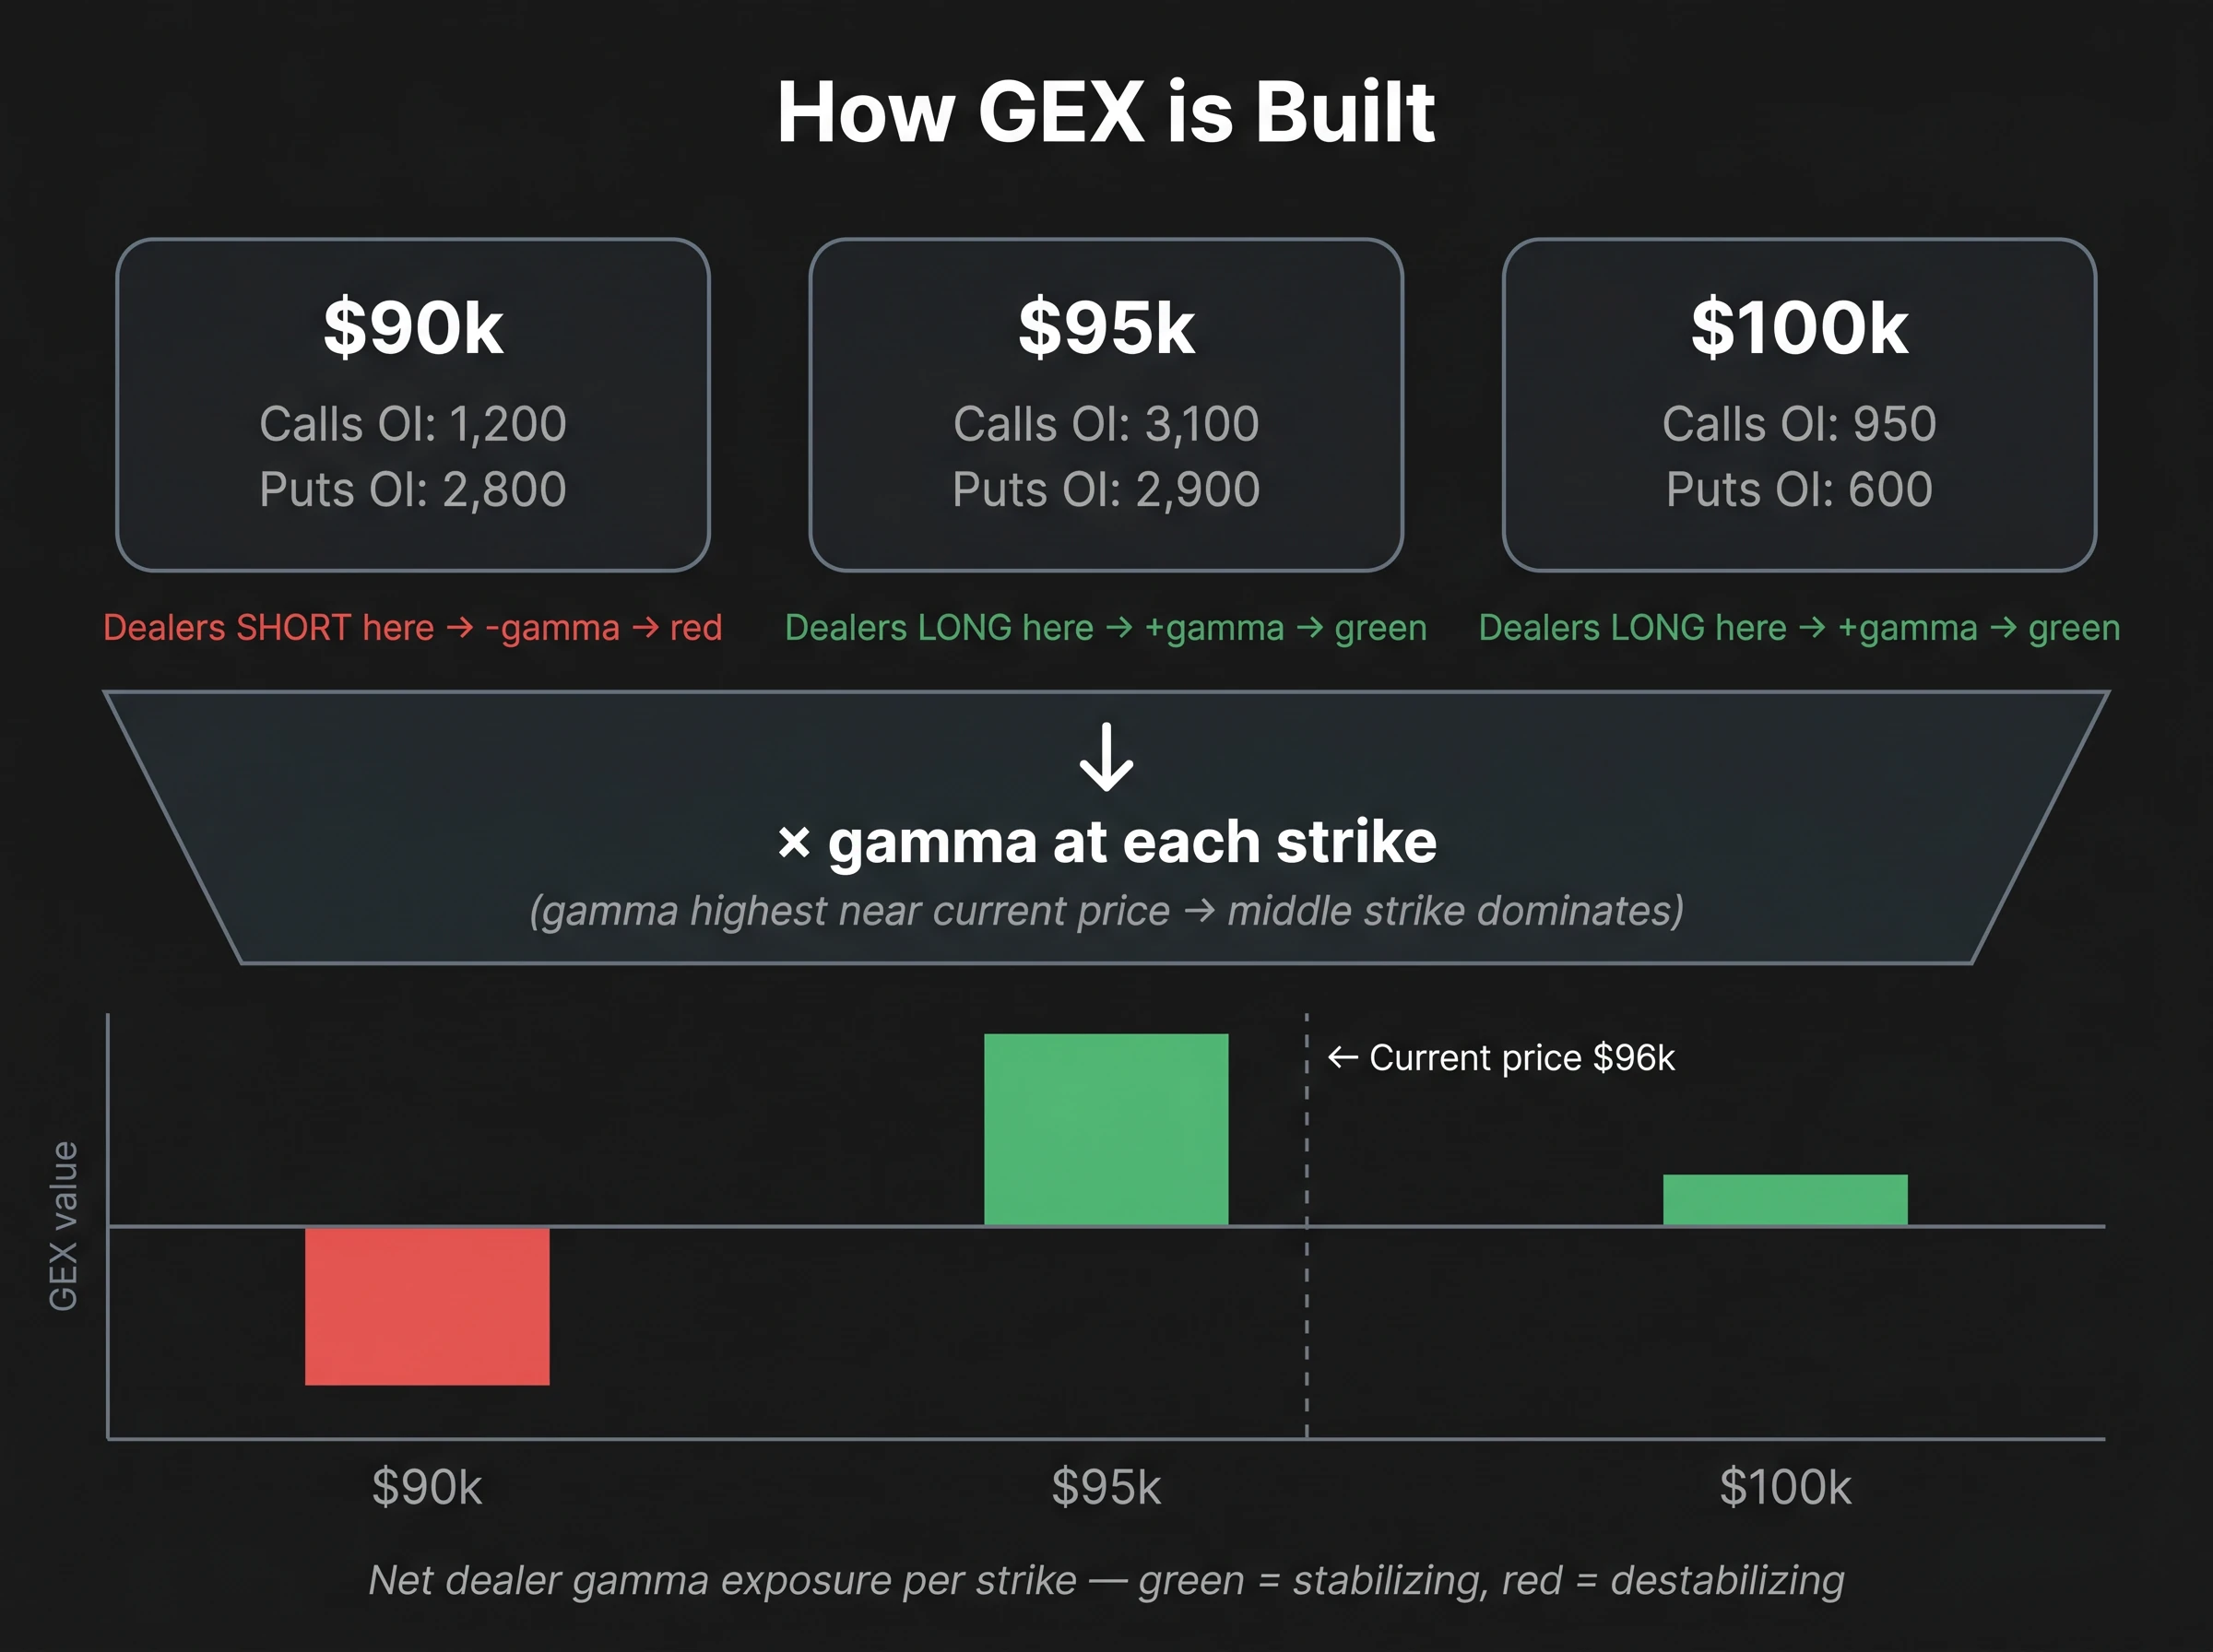
Two strikes can have the same open interest and look totally different on the chart. What matters is the sign — whether dealers are net long gamma there (green, stabilizing) or net short gamma (red, destabilizing).
The colors
GammaFlip uses a single visual convention:
- Green bars → positive net dealer gamma. Stabilizing. Hedging dampens moves.
- Red bars → negative net dealer gamma. Destabilizing. Hedging amplifies moves.
- Bar height → the magnitude of that hedging activity at that strike.
A tall green bar is not "support" in the technical-analysis sense. It's a strike where, as price approaches, dealers will increasingly trade against the move to keep their hedge neutral. The result looks like support, but the cause is mechanical.
A tall red bar is not "resistance" the way a chart pattern is. It's a strike where dealer hedging will accelerate whatever direction price is heading.
A real read
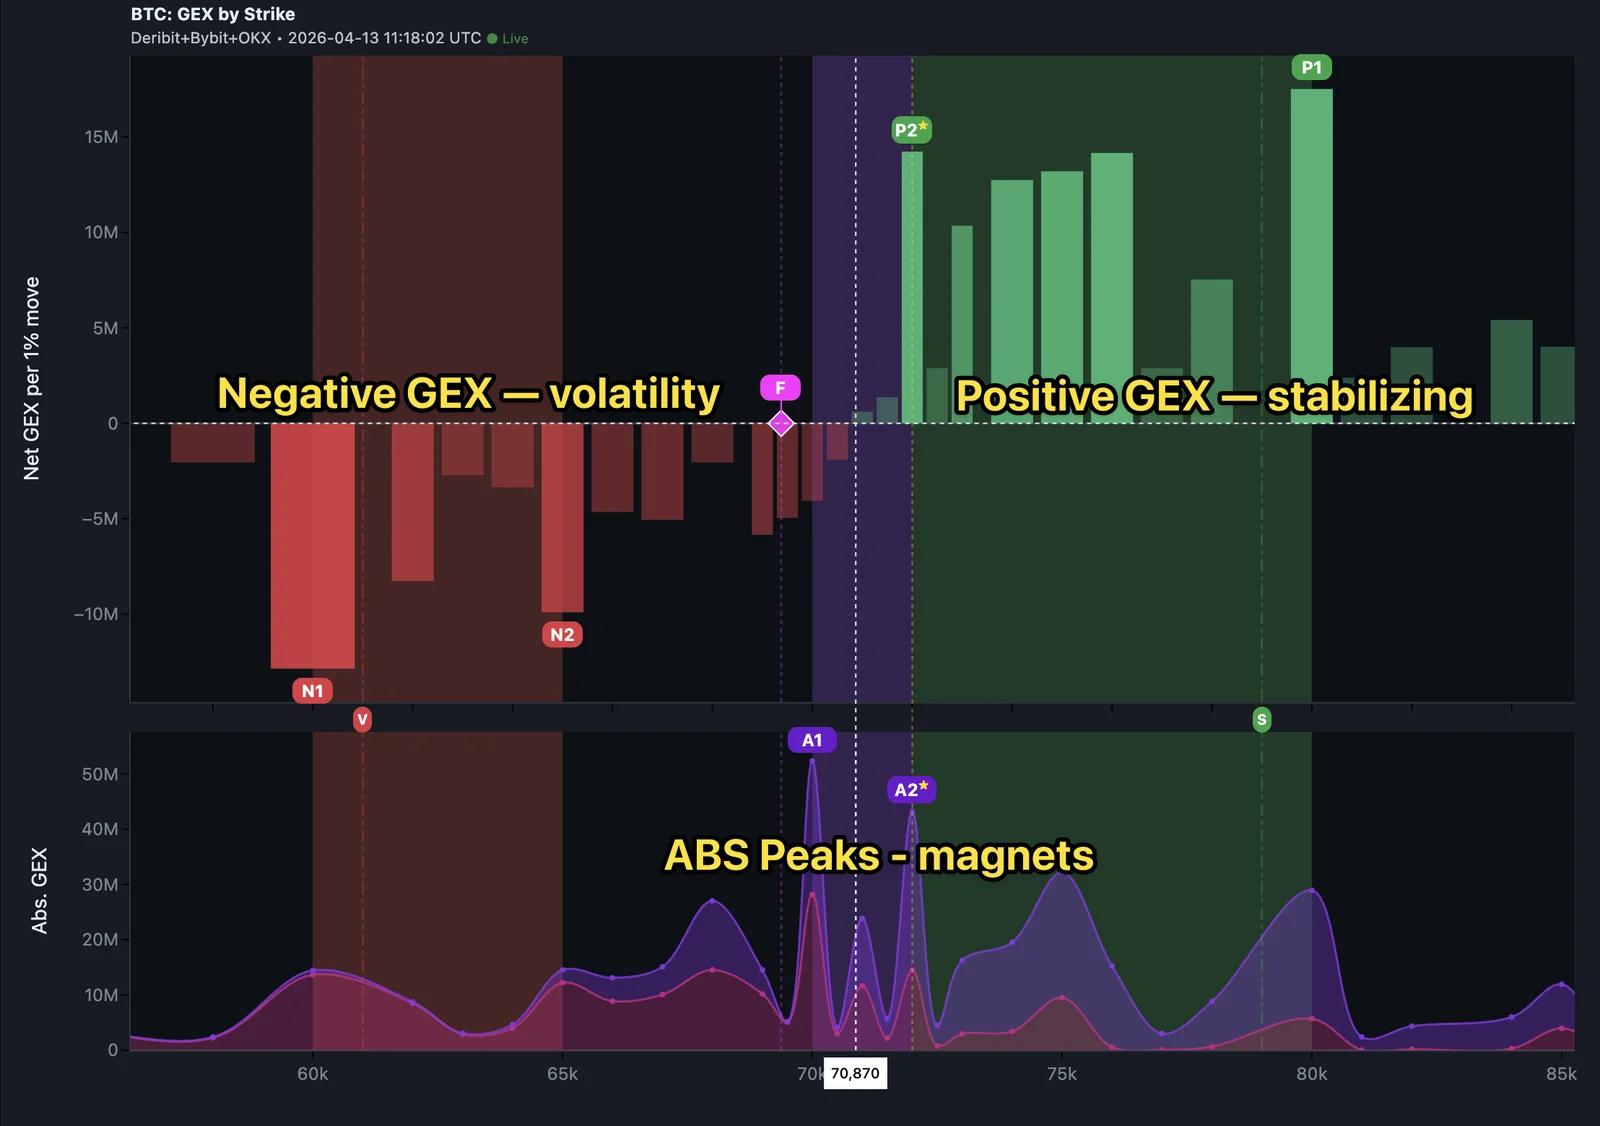
Walk through this profile from the bottom up:
- The tall green bars below current price are stabilizing strikes. Pulling power. Targets if price comes back to them.
- The Flip Point sits where green ends and red begins. This is the regime boundary you met in Track 1.
- The tall red bars above the Flip are destabilizing strikes. If price reaches them, the hedging flow there will tend to push further, not push back.
This is a map of forced dealer behavior, projected onto the price axis.
Net GEX — the one-number summary
Sum all the bars and you get a single composite number — Net GEX. The chart-level number you see in the header.
What GEX is not
Important boundaries on the read:
It's not a forecast. GEX shows you the hedging structure that exists right now. Open new positions, close old ones, reach an expiration — the structure changes. Today's GEX is today's read.
It's not gospel for non-options-driven moves. A spot-driven cascade triggered by a major liquidation, a regulatory headline, or a Bitcoin protocol event can override the GEX picture entirely. Dealer hedging is one force among several.
It's not the same on every exchange. Each venue has its own option flow. Deribit, Bybit, OKX all carry different OI distributions. The exchange selector matters.
These boundaries are why Track 2's later lessons — and the advanced tracks once they ship — keep coming back to "when to trust GEX and when to set it aside."
The takeaway
GEX is a snapshot of where dealer hedging will fight or feed price moves, strike by strike. Green bars stabilize. Red bars destabilize. Net GEX summarizes the whole picture in one number.
Next lesson: revisiting the Flip Point — now with the mechanism behind it.
Green hedges against the move. Red hedges with it. That's the whole chart.
Check your understanding
What three inputs go into a GEX bar at a single strike?
Open interest at that strike, the gamma of the option at that strike, and the sign of the dealer's position (long calls, short calls, etc.). Multiplied and netted across all options at that strike, you get one number — that's the bar.
If you see a tall green bar at $96,000 and a tall red bar at $105,000, what's the practical read?
$96,000 is a stabilizing level — dealer hedging will lean against price as it approaches. Treat it as a magnet / take-profit zone. $105,000 is a destabilizing level — if price gets there, hedging will accelerate the move. Treat it as a breakout zone, not a target.
Why is GEX a snapshot, not a forecast?
GEX is computed from current open interest. As traders open and close positions, OI changes — and the GEX profile changes with it. Today's profile tells you where dealer hedging would happen if positions stayed put. Major flow days, expirations, and macro events can reshape the profile within hours.