The Flip Point revisited
Explain the Flip Point mechanistically: why dealer hedging behavior literally inverts at this level.
In Track 1 you learned to use the Flip as a regime indicator. Above = sticky, below = jumpy. Now you can see why.
The fulcrum
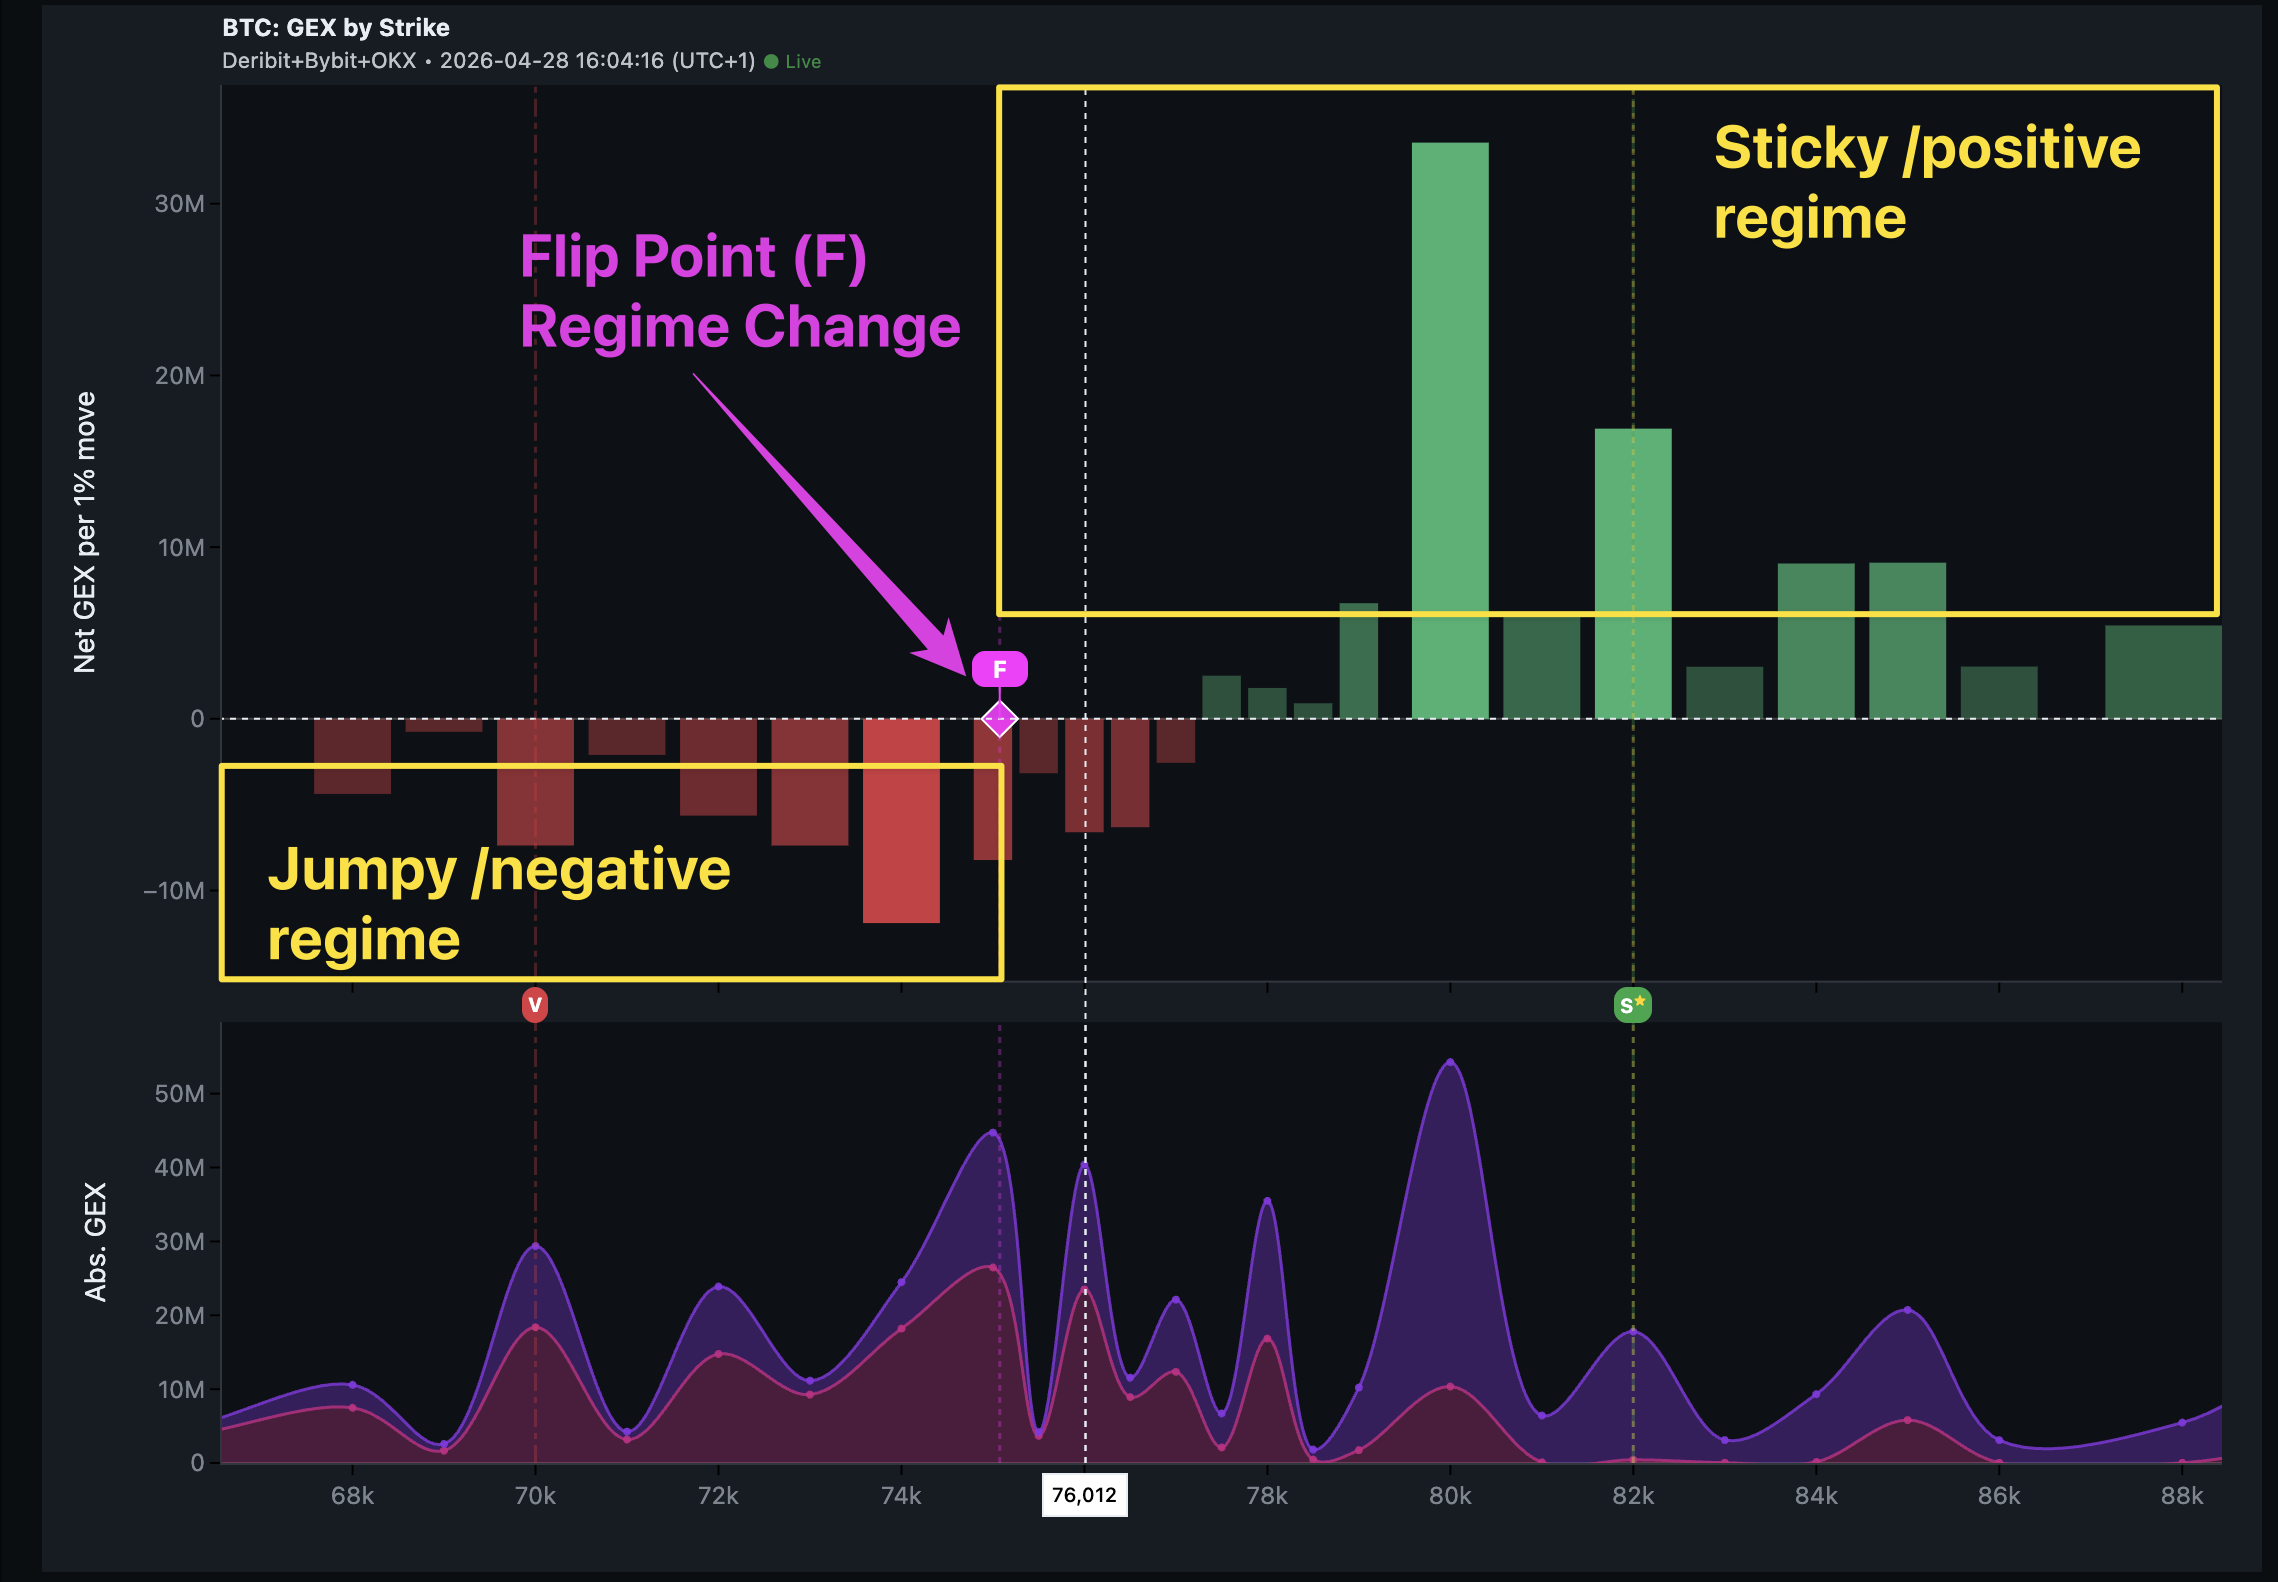
The Flip Point is the price level at which dealer gamma would flip sign. It's predictive, not descriptive: the app projects dealer gamma at hundreds of candidate spot prices across the strike range and finds the zero-crossing (usually interpolated between two strikes — not a strike itself).
That's why being above the Flip almost always coincides with positive current gamma, and being below with negative. The Flip is the boundary of those zones on the projected curve.
The same dealer, hedging the same book, behaves in opposite directions on either side of this line. They sell rallies and buy dips above. They buy rallies and sell dips below. The flow doesn't gradually transition — it inverts at the zero-crossing.
That's why the Flip is more than a level. It's a regime fulcrum.
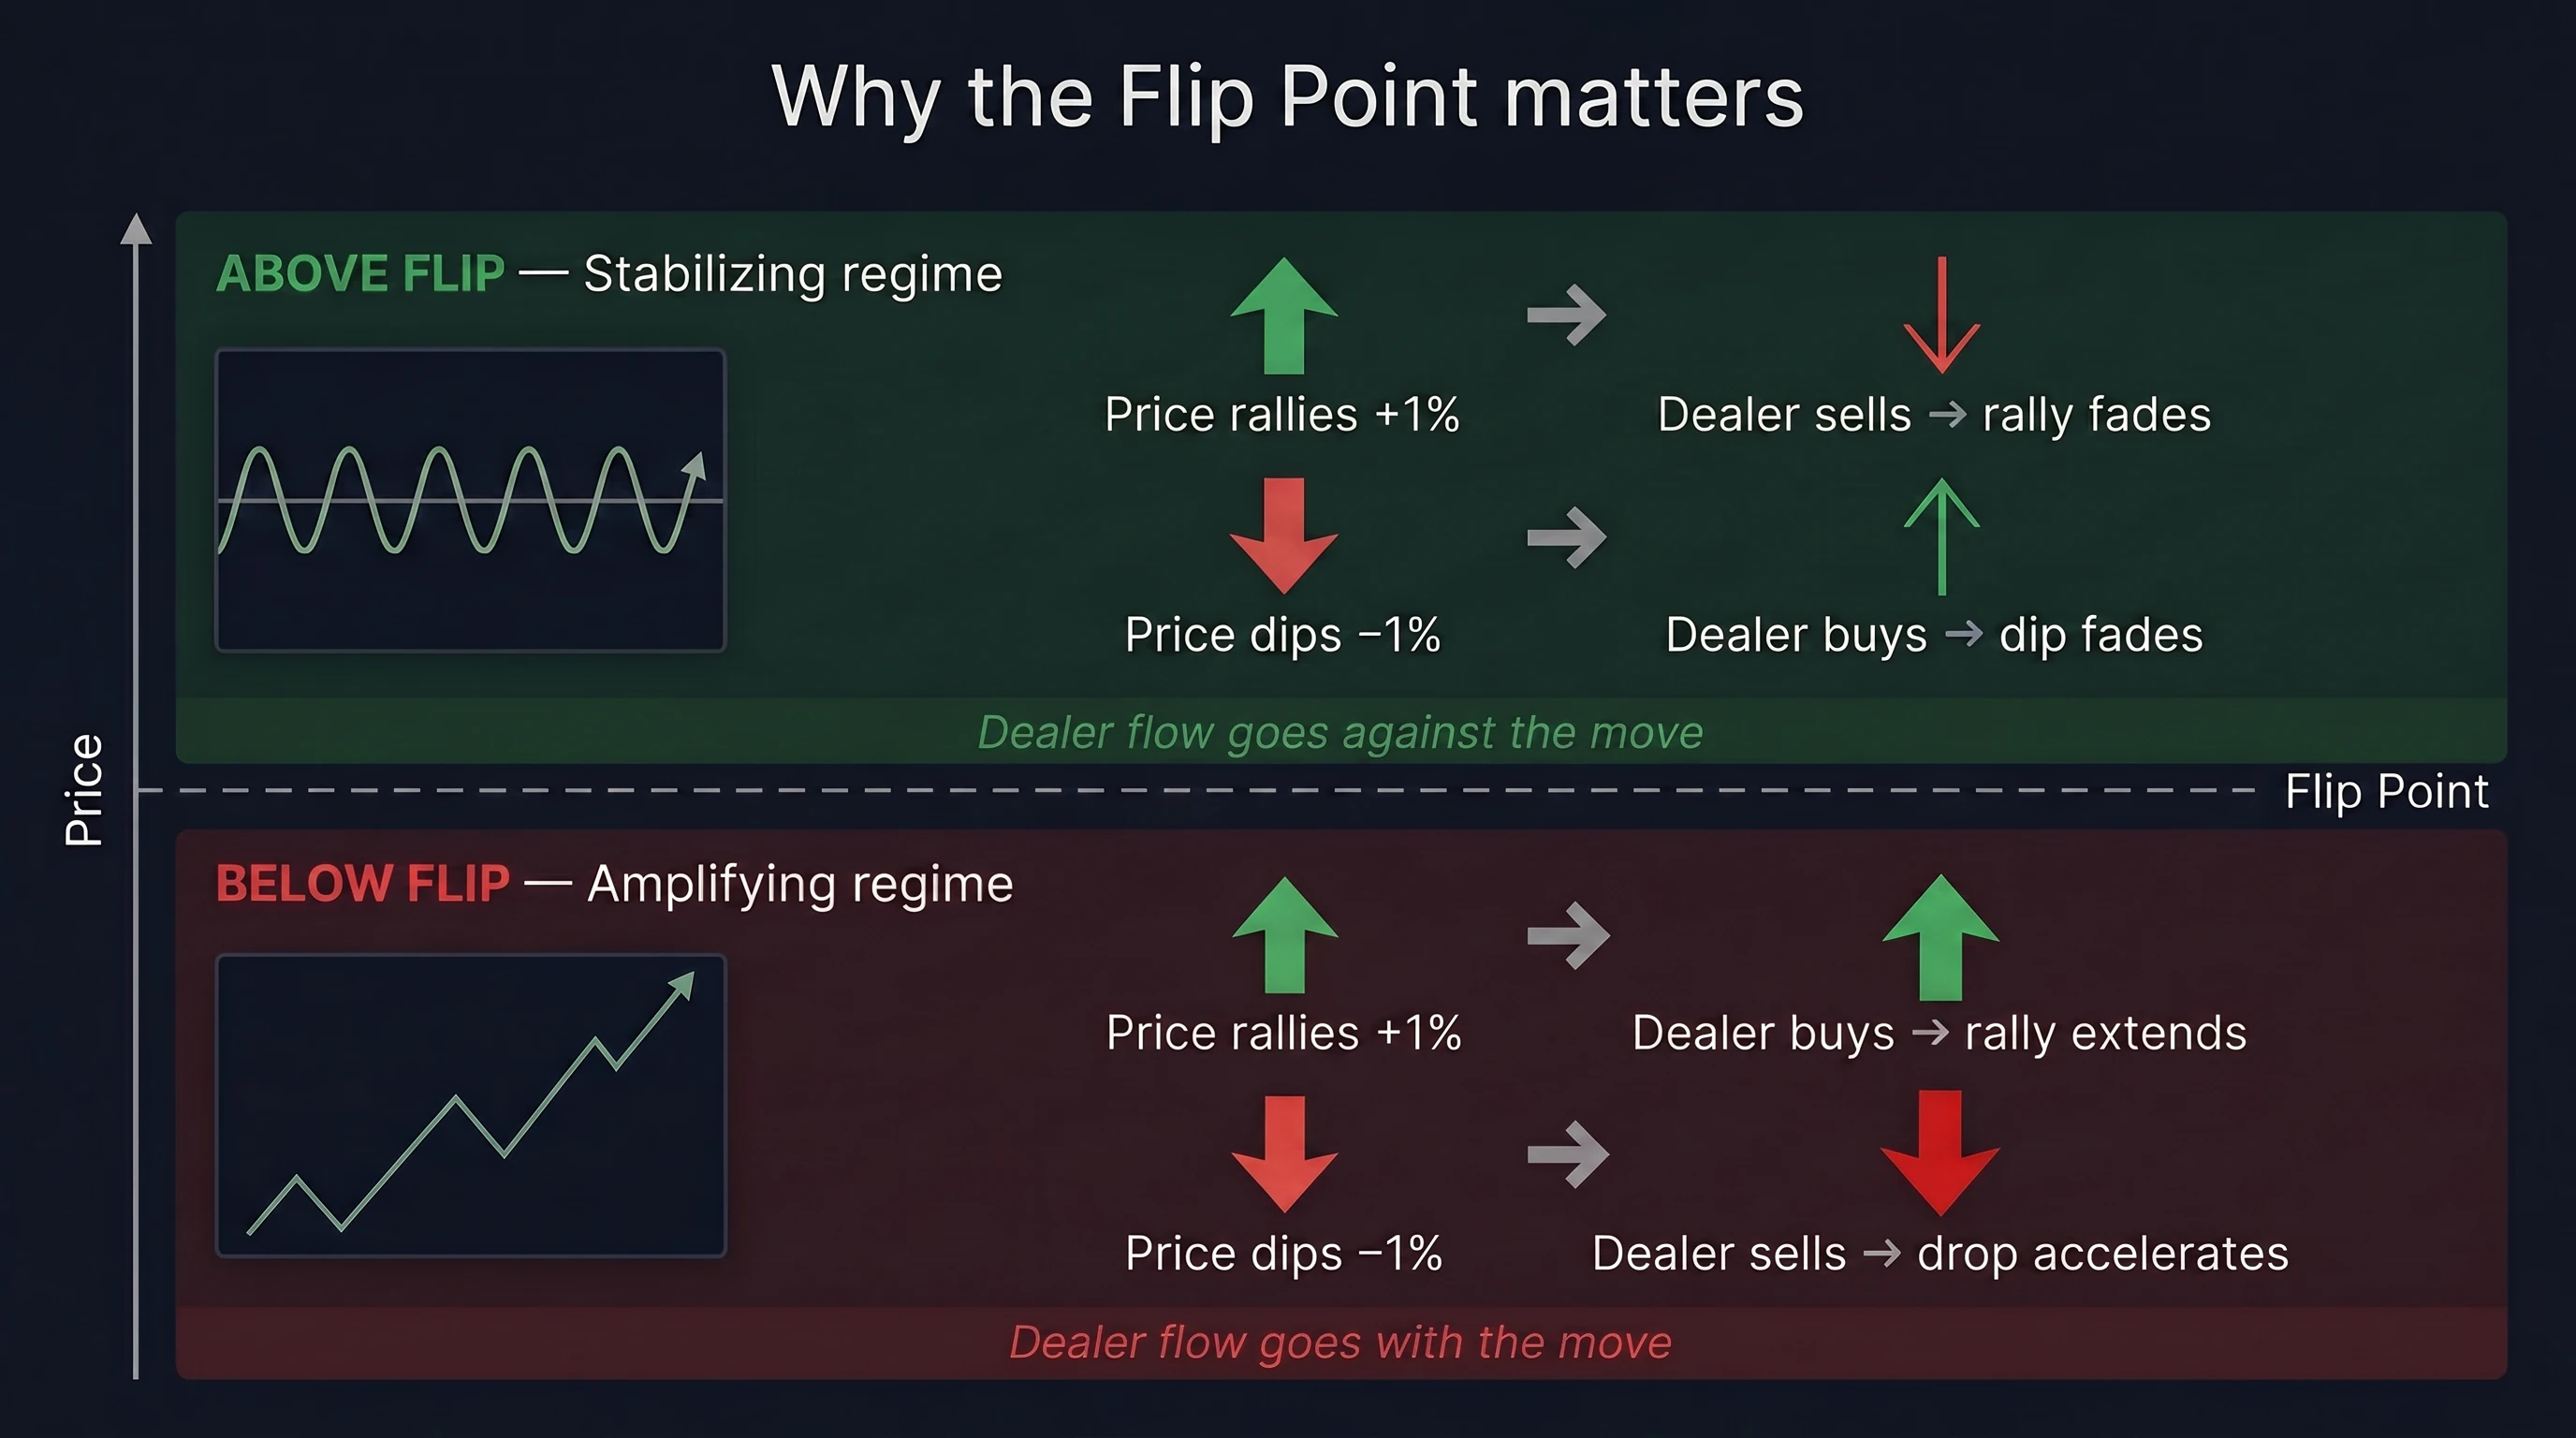
Above the Flip — magnetize
Above the Flip, dealer hedging is stabilizing flow. This is the "sticky" regime from Track 1, with a name for the mechanism: magnetize.
Spot rallies 1% → dealer's net delta gets too long → dealer sells spot → rally cools off.
Spot drops 1% → dealer's net delta gets too short → dealer buys spot → drop fades.
Repeated millions of times across thousands of contracts, this is what makes ranges hold. It's what makes obvious resistance levels actually act like resistance. It's why "buying the dip" works in this regime — you're trading alongside the dealer flow.
Below the Flip — accelerate
Below the Flip, the same hedging flips sign. This is the "jumpy" regime from Track 1, with a name for the mechanism: accelerate.
Spot drops 1% → dealer's net delta gets too short → dealer sells more spot → drop accelerates.
Spot rallies 1% → dealer's net delta gets too long → dealer buys more spot → rally extends.
In this regime, dealer flow is in the same direction as the move. Trends compound. Apparent levels break with little resistance. Mean-reversion strategies struggle because the structural flow is with the trend, not against it.
Why the Flip migrates
You may notice the Flip Point shifts price level day to day, sometimes meaningfully. This isn't noise — it reflects real changes in OI:
| Flow event | Effect on the GEX profile | Where the Flip moves |
|---|---|---|
| Large new call OI above current price | Adds positive gamma above | Flip drifts upward |
| Large new put OI below current price | Adds positive gamma around the put strike | Flip can pull downward |
| Friday 08:00 UTC settlement | Wipes out the week's expiring OI | Flip can jump to a new level entirely |
The Flip is responsive to flow. That responsiveness is also why post-expiration reads (Friday afternoon onward) are some of the most informative — you're seeing the new structure for the next week. Track 1 Lesson 9 covers the weekly rhythm in detail; what's worth holding here is that the Flip moves because flow moves, not because of price action alone.
Wicks vs closes
A common misuse: treating any tick through the Flip as a regime change.
It isn't. The dealer book doesn't recompose in 30 seconds. A wick through the Flip is usually a brief mispricing — the existing structure typically pulls price back inside the old regime within a candle or two.
What actually signals a regime change:
- A clean close through the Flip on the timeframe you trade
- Follow-through in the next session — not an immediate reversal
- Often, a coincident shift in Net GEX (positive flipping to negative or vice versa)
Wait for confirmation. The cost of being late to a regime change is much smaller than the cost of being whipsawed by every wick.
The takeaway
The Flip is mechanical. Dealer hedging inverts sign at this price level, and the regime you trade in inverts with it. Watch the level, watch the close, and let migrations of the Flip itself tell you when the structure is rebuilding.
Next lesson: how magnetize and accelerate change the way you read the same chart level.
Above F, the dealer fights price. Below F, the dealer feeds it.
Check your understanding
Why is the Flip Point a 'fulcrum' for dealer behavior, not just a chart line?
Above the Flip, dealers are net long gamma — their hedging dampens moves (sell rallies, buy dips). Below the Flip, they're net short gamma — their hedging amplifies moves (buy rallies, sell dips). The same dealer flips behavior at this single price level. That's the regime change.
Why does the Flip Point shift day to day?
It's the price level where summed dealer gamma crosses zero, and that sum depends on current open interest and current spot. Every option opened, closed, or expired changes the contributions. As OI redistributes — especially around expirations — the zero-crossing migrates.
What's the difference between price wicking through the Flip and price closing through it?
A wick happens fast and gets reversed by the existing dealer hedging structure — common noise. A clean close through, especially with follow-through volume, signals enough flow to actually move the dealer position composition. The first is intra-regime; the second is a regime change.