Walls: where price stalls
Identify P1 and P2 walls and use them as take-profit targets and mean-reversion levels.
In the previous lesson you learned that sticky markets mean-revert. Now let's look at where they mean-revert.
Not every green bar on the GEX chart is equal. Some are towering peaks that dominate everything around them. Those peaks are called walls — and they're the levels where the most stabilizing pressure concentrates.
What a wall is
A wall is a strike price (the fixed price baked into an option contract) with a large positive net gamma position. In plain terms: a level where market-making activity is heavily concentrated.
When price approaches a wall, the forces pulling it back are stronger than at other green levels. Think of it as a strong magnet versus a weak one — both pull, but one pulls much harder.
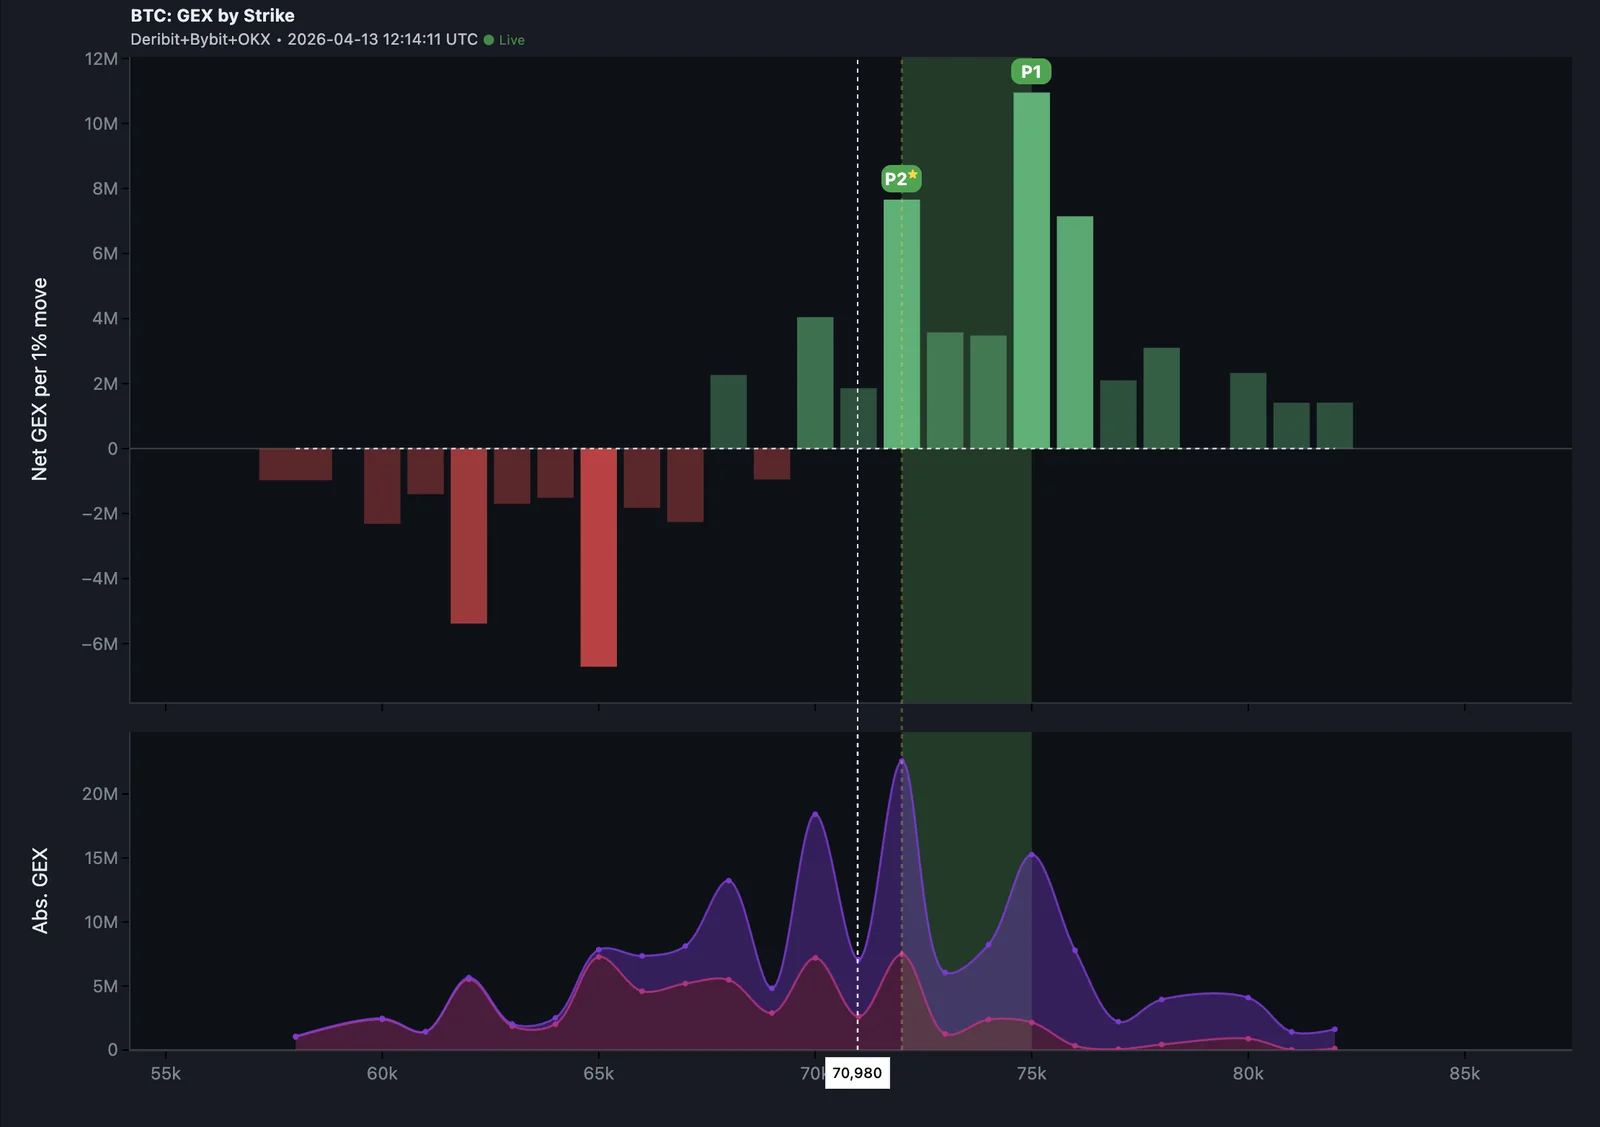
GammaFlip automatically identifies the two most important walls on any chart:
P1 — the largest positive gamma peak. The dominant wall. The level with the most stabilizing force.
P2 — the second-largest positive gamma peak. A meaningful secondary wall.
How walls behave — the two-sided rule
The key thing to understand about a wall is that it behaves differently depending on which side of it price is sitting.
Price below the wall (approaching from below): The wall acts as a ceiling with stabilizing pressure. Market makers (also called dealers — the firms quoting both sides of the options book) are more likely to sell into rallies that push toward this level. Price tends to stall, rotate, or reverse at the wall. This makes it a take-profit zone for longs.
Price above the wall (sitting on top of it): The wall flips to a floor with stabilizing pressure from below. Market makers are more likely to buy dips that pull back toward this level. Price tends to find support when it dips toward the wall. This makes it a support zone and potential long re-entry level.
The wall doesn't disappear when price passes through it — it changes orientation.
Using P1 as a take-profit target
The most reliable use of walls in a sticky regime is as take-profit zones.
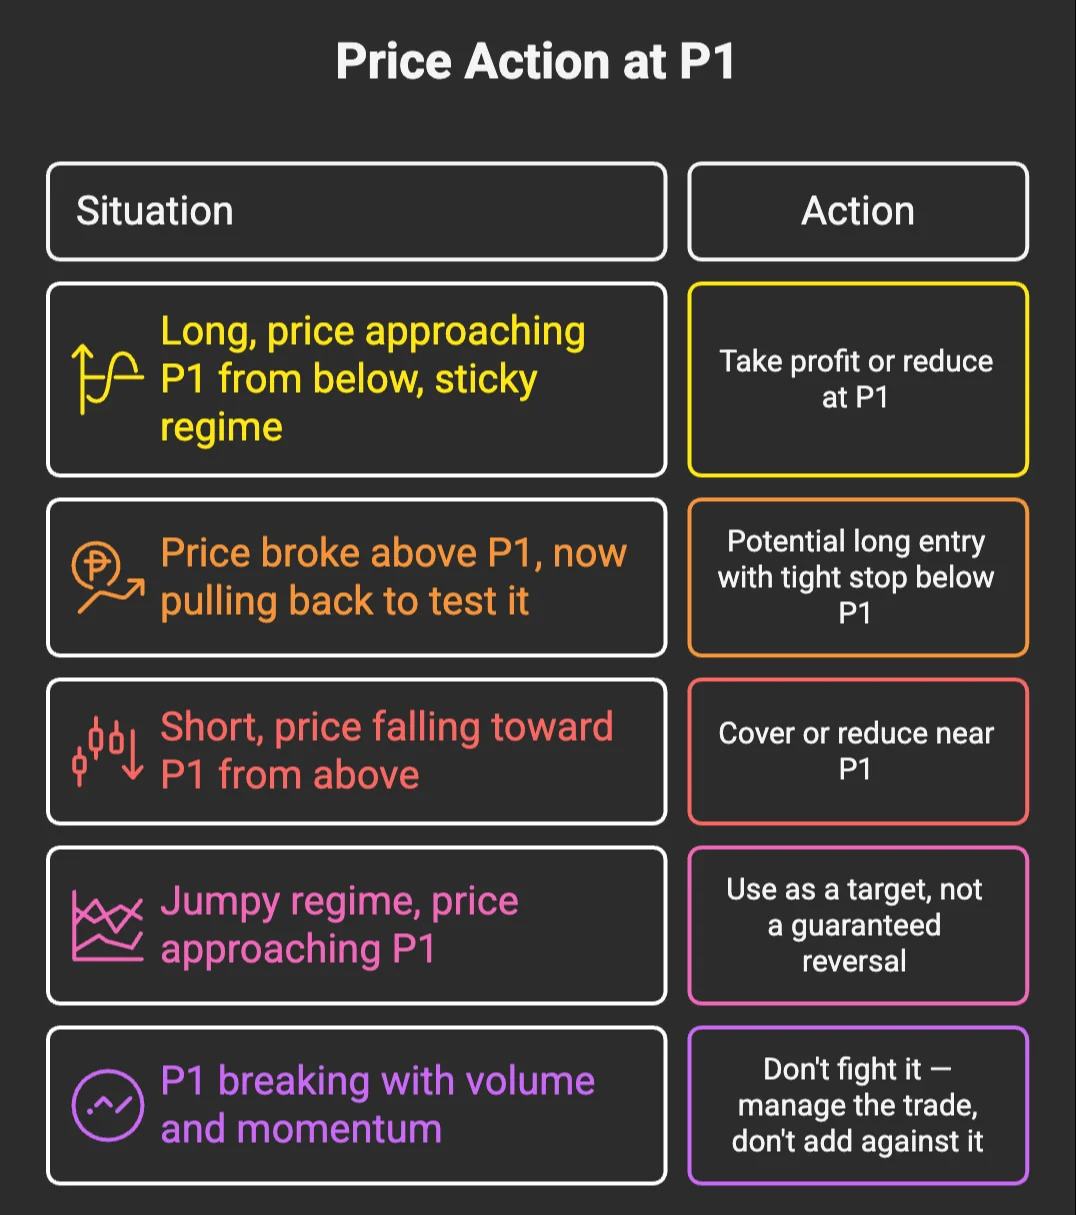
If you're long and price is approaching P1 from below, consider:
- Taking profits or reducing size at P1
- Not assuming the wall will break without confirmation (high volume, momentum)
- If P1 does break with conviction, that's a signal — but not a common occurrence in a sticky market
Why this works: In a sticky regime, there are active sellers at P1. Taking profits there puts you on the same side as that structural pressure. You're not fighting the tape — you're using it.
Using P1 as a mean-reversion entry
If price has broken above P1 and then pulls back to test it from above, you have a potential mean-reversion long entry.
The logic: 1. P1 was resistance 2. Price broke through with momentum 3. P1 now becomes support (flip from ceiling to floor) 4. A pullback to P1 in a sticky regime is buying the dip at the most structurally supported level on the chart
This is the wall flip trade. It works best when:
- You're in a confirmed sticky regime (price above Flip point)
- The initial break of P1 was clean, not just a wick
- Price comes back to test P1, not crash through it
Tight risk: your stop goes just below P1. If P1 fails to hold, the trade thesis is wrong.
P2 as a closer target
P2 works by the same logic as P1, just with less stabilizing force. When P1 is far away and P2 is nearby, P2 becomes the relevant level.
A common mistake is ignoring P2 because P1 seems more important. Start with the nearest meaningful wall. P2 at $2,000 away matters more right now than P1 at $6,000 away.
When walls don't hold
Walls are not hard stops. They're probabilistic zones, not guarantees.
A wall fails when:
- There's a strong fundamental catalyst (macro news, exchange event)
- You're in a jumpy regime (below the Flip) — walls become less reliable as reversal points and more likely as temporary pauses before continuation
- Open interest structure shifts intraday (walls can move as expirations approach)
When you see a wall breaking with conviction and volume, don't fight it. A breaking wall in a jumpy regime often accelerates once the level clears.
The next lesson covers the dangerous twin on the other side of the chart: negative walls (N1 and N2). They look like P1 and P2, but the trading rules are the opposite.
Check your understanding
P1 is at $97,000. Price is currently at $96,000 in a sticky regime. You're long. What's a reasonable plan?
Target P1 at $97K as your take-profit zone. In a sticky regime, P1 is a strong stabilizing wall — price tends to stall or reverse there. Taking profits into this level is structurally sound.
Price has broken above P1 and is now sitting just above it after a pullback. What does P1 become?
P1 flips from resistance to support. In a positive gamma environment, dealers now buy dips toward P1, turning the former ceiling into a floor. This is a potential long entry with P1 as the stop level.
P1 is $5,000 above current price. P2 is $2,000 above current price. Which level is more relevant to your next trade?
P2, because it's closer to current price. Start with the nearest relevant wall. P1 is the more powerful level, but P2 is your immediate target/resistance.