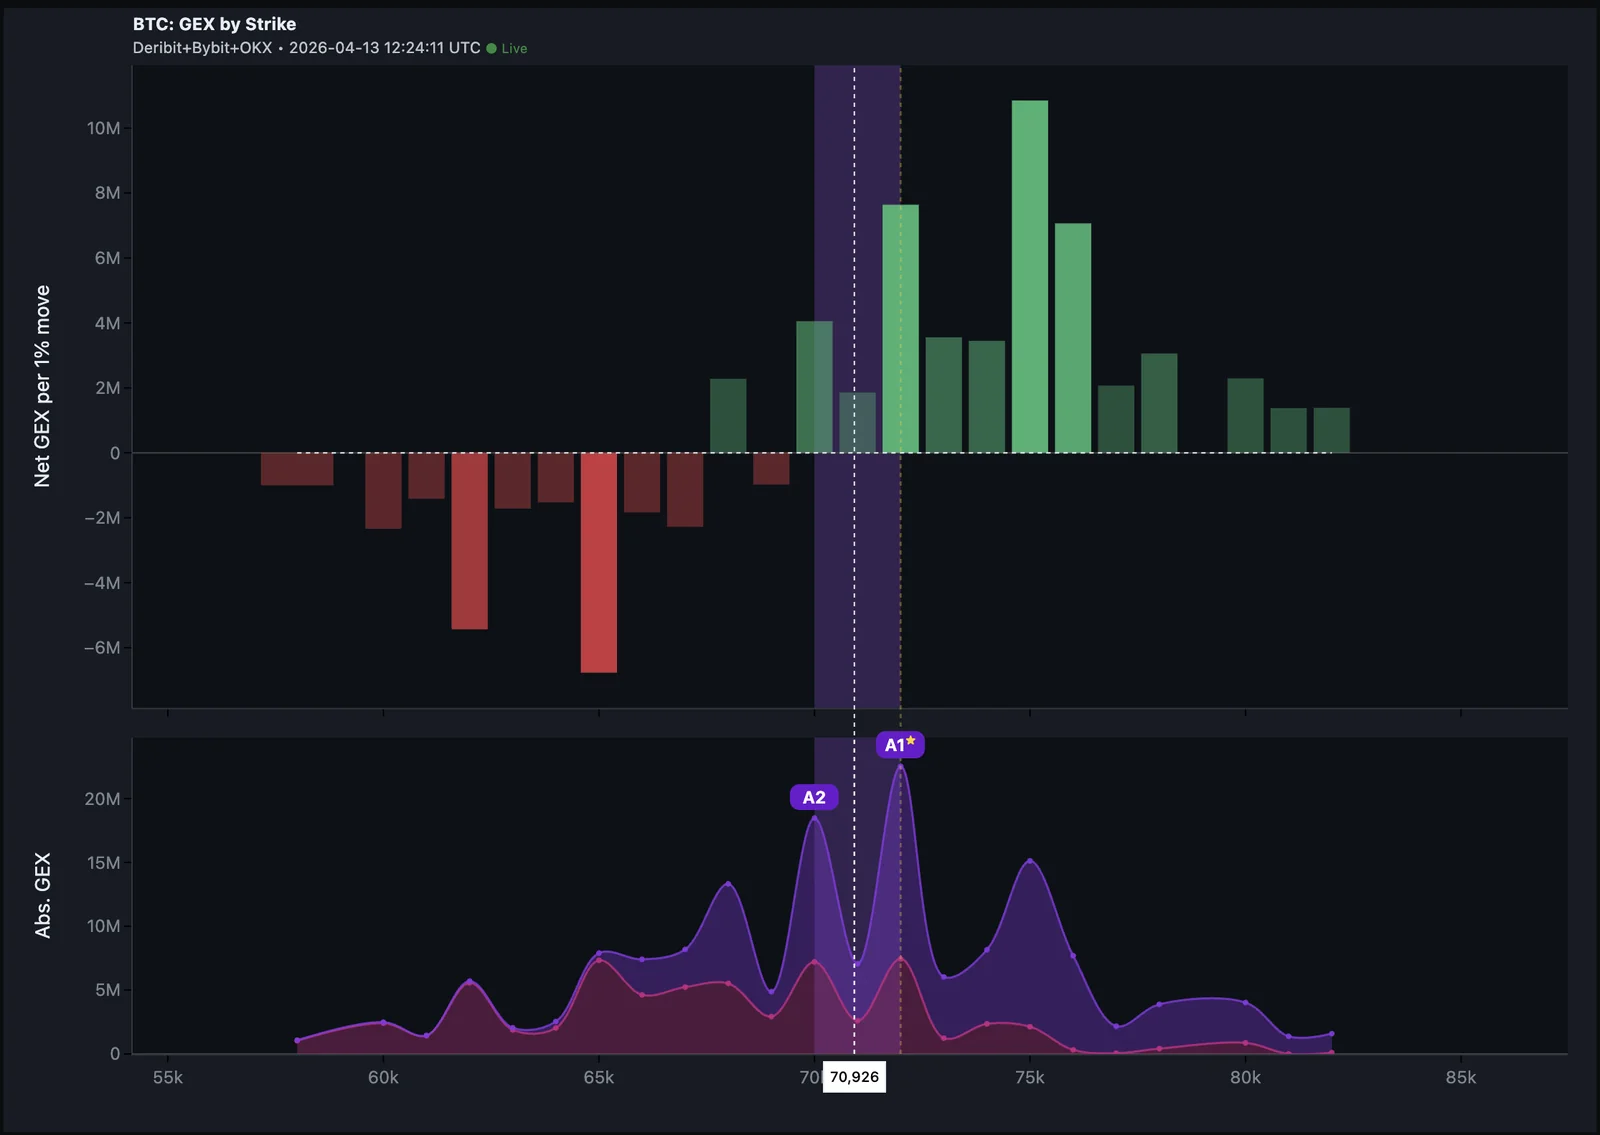
Absolute walls (A1/A2): where the options pile up
Identify A1/A2 as the highest-activity strikes — high-volume zones at any time, strong pinning magnets at Friday's 08:00 UTC settlement.
You've now seen the two categories of signed gamma walls: positive (P1/P2) and negative (N1/N2). This lesson covers a different category entirely — one that doesn't care about sign at all.
These are the absolute walls. They show up as A1 and A2 on the chart.
What A1 and A2 are
A1 and A2 mark the strikes with the highest total gamma — calls plus puts combined, regardless of whether the net is positive or negative. They measure pure concentration of options activity at a price level.
A strike with massive put open interest (OI — the number of option contracts currently outstanding at that strike) and equal massive call open interest could have net zero gamma — no P1/N1 marker — but a huge absolute value. That's where A1 lives.
Why this matters: volume, pressure, and pinning
A1 and A2 sit where the options market has the most contracts on the books. That has two consequences for traders, and they're both useful — at different times.
First, expect high volume around A1/A2 — anytime. Market makers running large books at these strikes create constant two-way hedging flow (the buying and selling dealers must do to stay neutral as price moves) whenever price moves nearby. That flow shows up as tighter spreads, deeper order books, and visibly more trade volume on the perp/spot side as price approaches. Even on a quiet Tuesday mid-cycle, A1 is a level where you'll see more activity than at a quiet strike with little OI. If your trade plan involves a level near A1, expect more noise, more wicks, and more aggressive both-way flow there.
Second, expect pinning — strongest in the final stretch of the Friday cycle. The same hedging flow that creates volume also tends to anchor price. As the Friday 08:00 UTC settlement approaches, time pressure on the hedging accelerates, and price gravitates toward A1. This is the textbook pinning effect — and it's the most distinctive feature of A1/A2.
You'll also see a marker called Max Pain (MP) on the chart. It's a related pinning measure computed differently. When A1 and MP land on the same strike, the pinning is the strongest you'll see. The full mechanics are an options-side topic — for depth, see the blog post Max Pain Explained.
How A1/A2 differ from P1/P2
This is where most traders trip up:
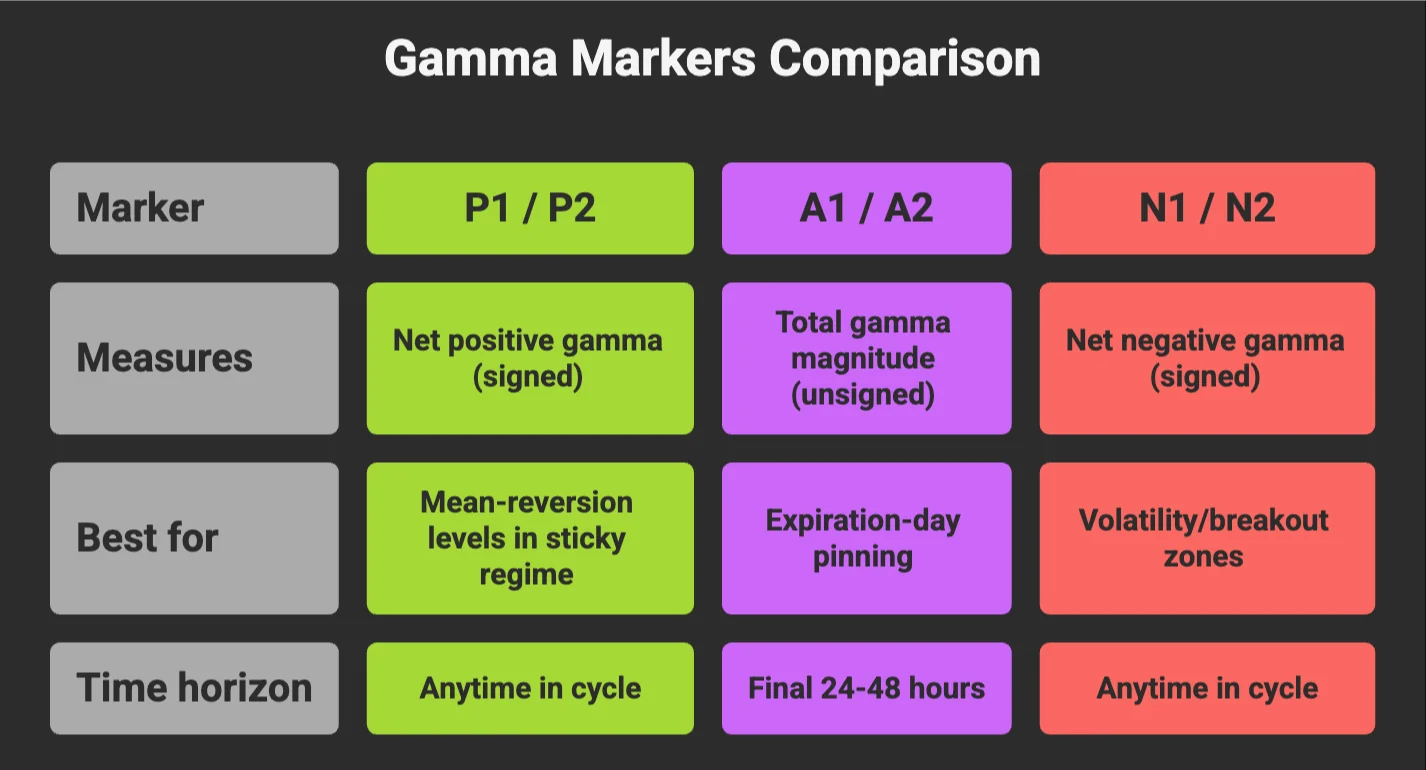
A1 and A2 are not "stronger" P1/P2 levels. They're a different signal that does a different job: marking volume concentration first, and pinning when timing aligns.
The Friday playbook
The pinning effect compounds as Friday's 08:00 UTC settlement approaches. Here's the practical timeline:
More than 1 week out: A1/A2 are reference points but not dominant. Trade off P1/P2 and the Flip.
Final 48 hours: Pinning starts to assert itself. Watch how price behaves around A1 — drifts toward it tend to stick.
Last 8-12 hours before Friday 08:00 UTC: A1 acts like a magnet. Counter-trend bounces fade quickly. Price chops in narrow ranges within the A1 zone.
Settlement minute: Price often closes within $50-200 of A1 on calm days, especially when A1 = Max Pain.
If you're holding a perp through Friday morning, A1 is the level you should reference for take-profit and stop placement, not your favorite TA level.
When pinning fails
Pinning isn't a guarantee. It fails when:
- A strong directional catalyst hits the market (macro news, exchange event, large liquidation cascade)
- Open interest is unusually thin (low pinning force)
- A1 sits far from current spot — the magnet only pulls within reasonable range, typically 1-2% of price
If price is more than ~3% from A1 going into Friday, don't expect a strong pin. Trade the actual structure (P1/P2/N1/N2) instead.
Quick mnemonic
P1 stalls price. A1 attracts volume — and pins price on Fridays.
A1 is not "just data" outside the Friday cycle — it's the level where the highest options activity sits, which means the most order flow and the deepest liquidity at any time. The pinning is the bonus that arrives near settlement.
Next lesson: Confluence — how to read the GEX chart when multiple markers (P, N, A, plus the Flip) all stack at the same level.
Check your understanding
It's Friday morning. BTC is at $96,500. A1 is at $97,000 and Max Pain is also $97,000. What's the structural bias for the rest of the day?
Strong upward magnet to $97,000. When A1 aligns with Max Pain, the pinning effect compounds. Expect price to gravitate toward $97K into Friday's close unless a strong external catalyst breaks the structure.
It's a quiet Tuesday, two weeks before the next Friday cycle ends. How much weight should you give A1/A2?
The pinning effect is weak that far out, but A1/A2 still mark the highest-volume strikes on the chart. Expect more order flow and tighter liquidity around those levels — useful for understanding where two-way activity concentrates, even if price isn't being magnetized to them yet. Pinning dominance only kicks in within the final 24-48 hours.
What's the difference between P1 and A1?
P1 is the largest *positive* gamma peak — net stabilizing pressure. A1 is the largest *absolute* gamma peak — total option activity (calls + puts combined, ignoring sign). A1 can sit at a strike with mostly puts, mostly calls, or both — it just measures concentration of total gamma.