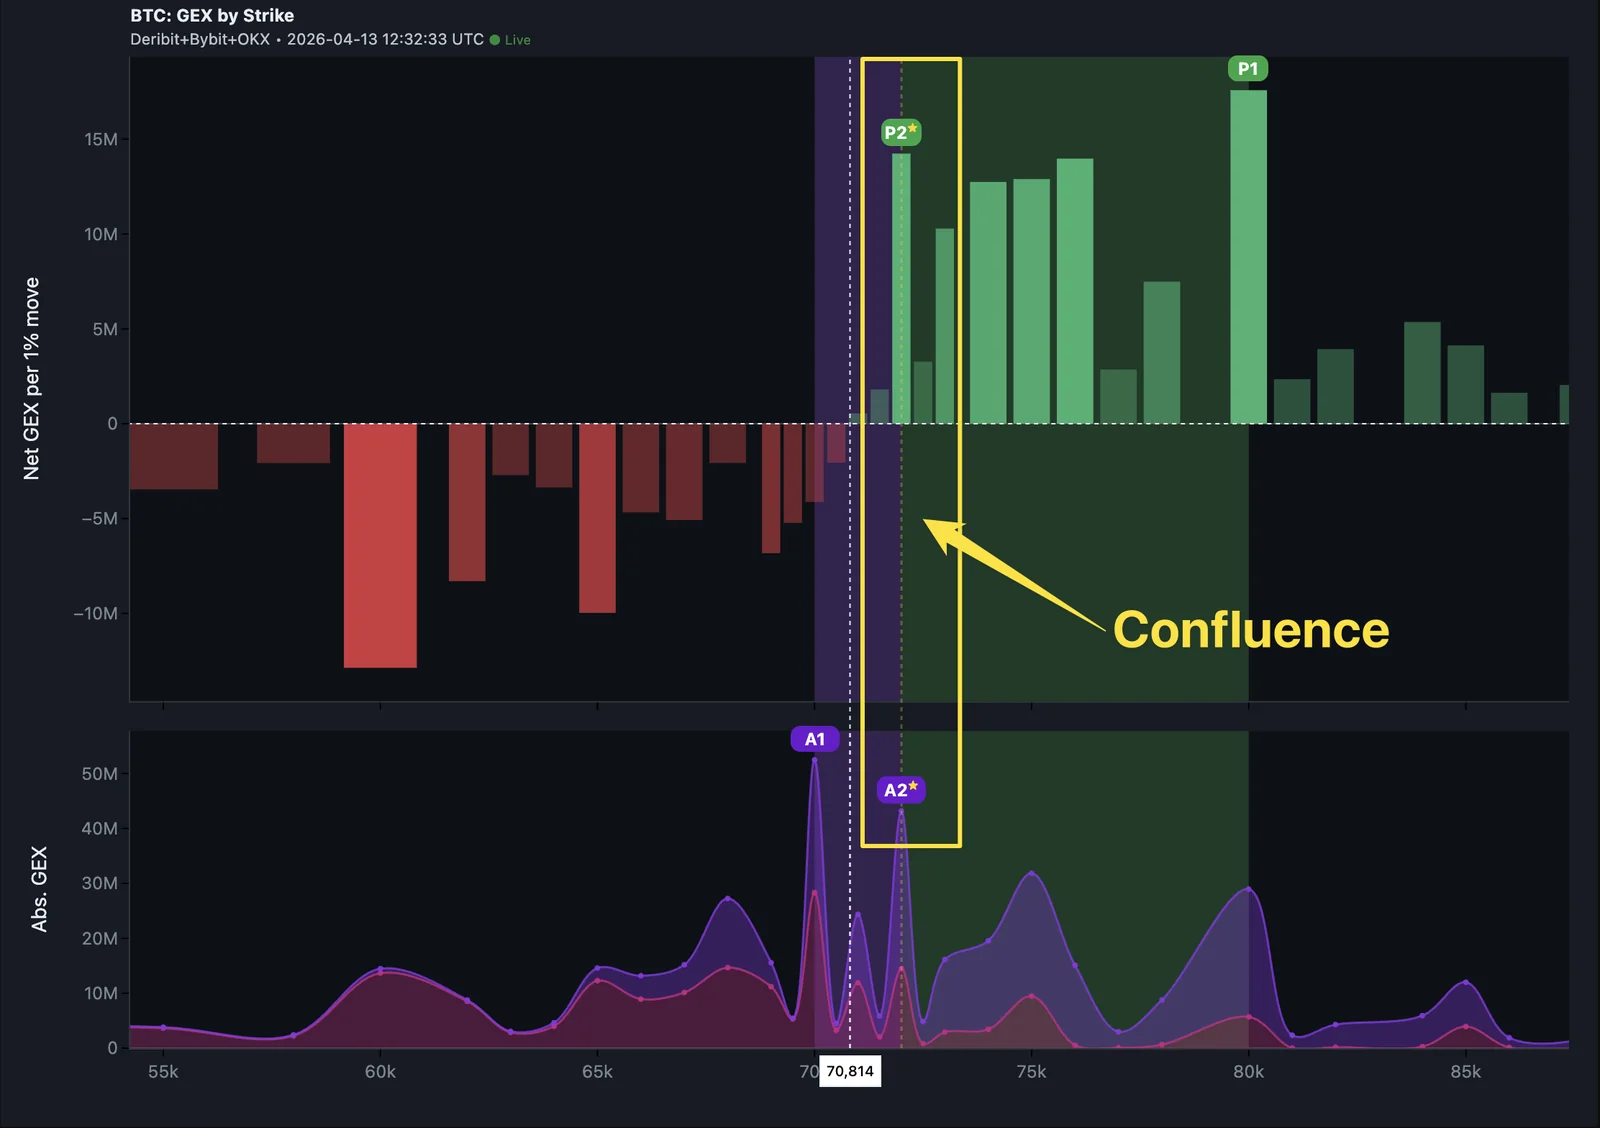
Confluence: where signals stack
Spot the gold ★ marker and use confluent levels as higher-conviction take-profit and stop zones.
Up to now you've learned each marker type one at a time: walls (P1/P2), negative walls (N1/N2), and absolute walls (A1/A2). Real charts don't separate them. They mix.
This lesson teaches you to spot when markers from different categories align at the same price — and why that alignment dramatically changes the trade.
The gold ★ marker
GammaFlip flags confluence automatically. When two markers from different categories land on the same strike (within 0.5% of each other), each badge gets a gold star.
You'll see badges like:
- P1★ — P1 plus another marker (often A1 or S) at the same level
- A1★ — A1 plus another marker
- N1★ — a negative wall plus another marker (rare but powerful)
- A vertical gold dotted line on the chart marking the strike
The star is doing the math for you. It's a quick visual flag for "this level has more than one structural force behind it."
What counts as confluence
Confluence requires markers from different categories:
| Markers | Category | Measures |
|---|---|---|
| P1, P2 | Positive peaks | Net GEX most positive — sticky ceilings |
| N1, N2 | Negative peaks | Net GEX most negative — move amplifiers |
| A1, A2 | Absolute peaks | Highest total options activity (unsigned) |
| S | Stability | Highest forecast gamma stability |
| V | Volatility | Forecast peak volatility strike |
Two markers from the same category don't trigger a star. P1 + P2 isn't confluence — they're both net-positive gamma peaks saying the same thing. But P + A, P + S, N + A, N + V are all cross-category pairs and do trigger it.
A note on S and V: these are forecast markers covered in depth in Track 2 — Options Curious. For Track 1, you don't need to use them as primary signals. Just treat their stars as bonus confirmation when they happen to align with a P or N you're already trading. P+A and N+A are the workhorse patterns for perp-trader use.
The whole point is to find places where structurally independent measures agree.
Why confluence is more reliable
Each individual marker measures one thing. Confluence means the level shows up in two or more measurements that are computed from different inputs. That's epistemically stronger.
A plain P1 says: "Net positive gamma is highest here."
A plain A1 says: "Total options activity is highest here."
A plain S says: "Gamma stability is forecast highest here."
When two of these land on the same strike, you have two independent reasons to expect a price reaction at that level — not one. The probability of both signals being noise is much lower than either being noise alone.
High-value confluence patterns
A few patterns show up often enough to memorize:
P + A (ceiling confirmed from two angles) The net positive gamma peak and the total activity concentration agree on the same level. One measure is directional (net signed GEX), the other is undirected (total absolute GEX) — they're computed differently and both point here. The most common and reliable confluence setup for take-profit targets in a sticky regime.
N + A (amplified bearish zone) Same logic, bearish side. The net negative gamma wall — where dealers add fuel to down-moves — aligns with the heaviest options concentration. When price enters this zone, structural forces from two independent measures are pointing the same direction. Reliable target for exits from longs or confirmation for shorts.
P + S (most durable ceiling) The net positive gamma peak aligns with the stability forecast point. P is where net gamma peaks; S is where gamma stability is forecast highest — a related but separately computed measure. When they coincide, the ceiling is confirmed by two methods and tends to hold across multiple sessions. Highest-conviction take-profit zone in a sticky regime.
N + V (breakdown accelerator) The negative gamma wall aligns with the forecast peak volatility strike. N marks where dealers amplify moves; V marks where volatility is expected to peak. When they coincide, a break into this zone isn't just entering negative-gamma territory — it's also the market's own forecast of maximum turbulence. Moves through N★ + V tend to be sharper and more sustained. Use as a stop trigger or short entry confirmation.
How to use confluence in your trade plan
The simplest rule: prefer confluent levels for entries and exits over solo markers.
When sketching a trade plan, scan the chart for stars first:
- Are any P★, N★, or A★ within reach of current price? Those are your priority levels.
- Is your take-profit aligned with a star? If yes, it's a higher-conviction target.
- Is your stop sitting at a star? Reconsider — stars are reaction zones, not flat barriers. You may want to place the stop a bit beyond.
- If no stars are nearby, fall back to single-marker analysis from the previous lessons.
When the star is misleading
Confluence boosts signal but doesn't override the basics. Common traps:
- Confluence doesn't override regime. A P1★ overhead is high-conviction when price can reach it — meaning the market is sticky, drifting between walls. If price has dropped below the Flip into a jumpy regime, that same overhead P1★ is still well-formed, but it's no longer the relevant near-term level. Momentum traders below the Flip are watching N★ markers and the Flip itself, not walls $5K overhead. Always check the Flip first to see which side of the chart is in play.
- A confluent level doesn't override news. If a major catalyst is moving the market, structure stops mattering. Confluence helps in normal conditions, not in crashes or shocks.
- Multiple stars on the chart dilute their meaning. If everything is starred, nothing is. Watch which stars are closest to current price and which align with the most distinct categories.
Quick mnemonic
One signal is a clue. Two signals (★) is a thesis.
A trade built around a confluent level has more structure behind it than a trade built on a single marker. That's the whole edge of reading the chart this way.
You now have the full marker vocabulary. The next lesson rounds out the toolkit with the heatmap — a different way to view GEX that reveals patterns the snapshot can't show. From there, the remaining lessons cover application: combining GEX with your existing TA, handling the Friday cycle, and when to ignore the chart entirely.
Check your understanding
You see P1★ on the chart at $98,000. What does the star tell you that you wouldn't know from a plain P1?
It tells you a second marker from a different category lands within 0.5% of P1 — for example, A1 at $97,950 or S at $98,100. The star is a confluence flag. Plain P1 is one signal; P1★ is at least two signals agreeing.
Which is a stronger take-profit zone: a plain P1 at $96,000 with no nearby markers, or a P1★ at $94,500 with A1 also at $94,500?
P1★ at $94,500. The star means two independent measures (net positive gamma + total gamma concentration) both point to the same level. That alignment makes it a higher-conviction reaction zone, even though it's $1,500 further from current price.
Two P-markers (e.g., P1 and P2) sit on adjacent strikes. Do they form confluence?
No. Confluence requires markers from *different categories*. P1 + P2 are the same category (positive gamma peaks) — they don't trigger the star. P1 + A1, P1 + S, or P1 + V — those are confluence. Note that Flip and Max Pain are structural reference markers, not part of the ★ system.