Combining with your existing TA
Layer GEX levels on top of your existing technical analysis to find higher-conviction entries and exits.
You already have a trading workflow. You scan charts, mark levels, watch order flow, track funding. Adding GEX shouldn't replace any of that — it should layer on top of it.
This lesson covers how to fold the markers you've learned into a workflow that already works for you, without rebuilding from scratch.
The mental model: GEX as a context layer
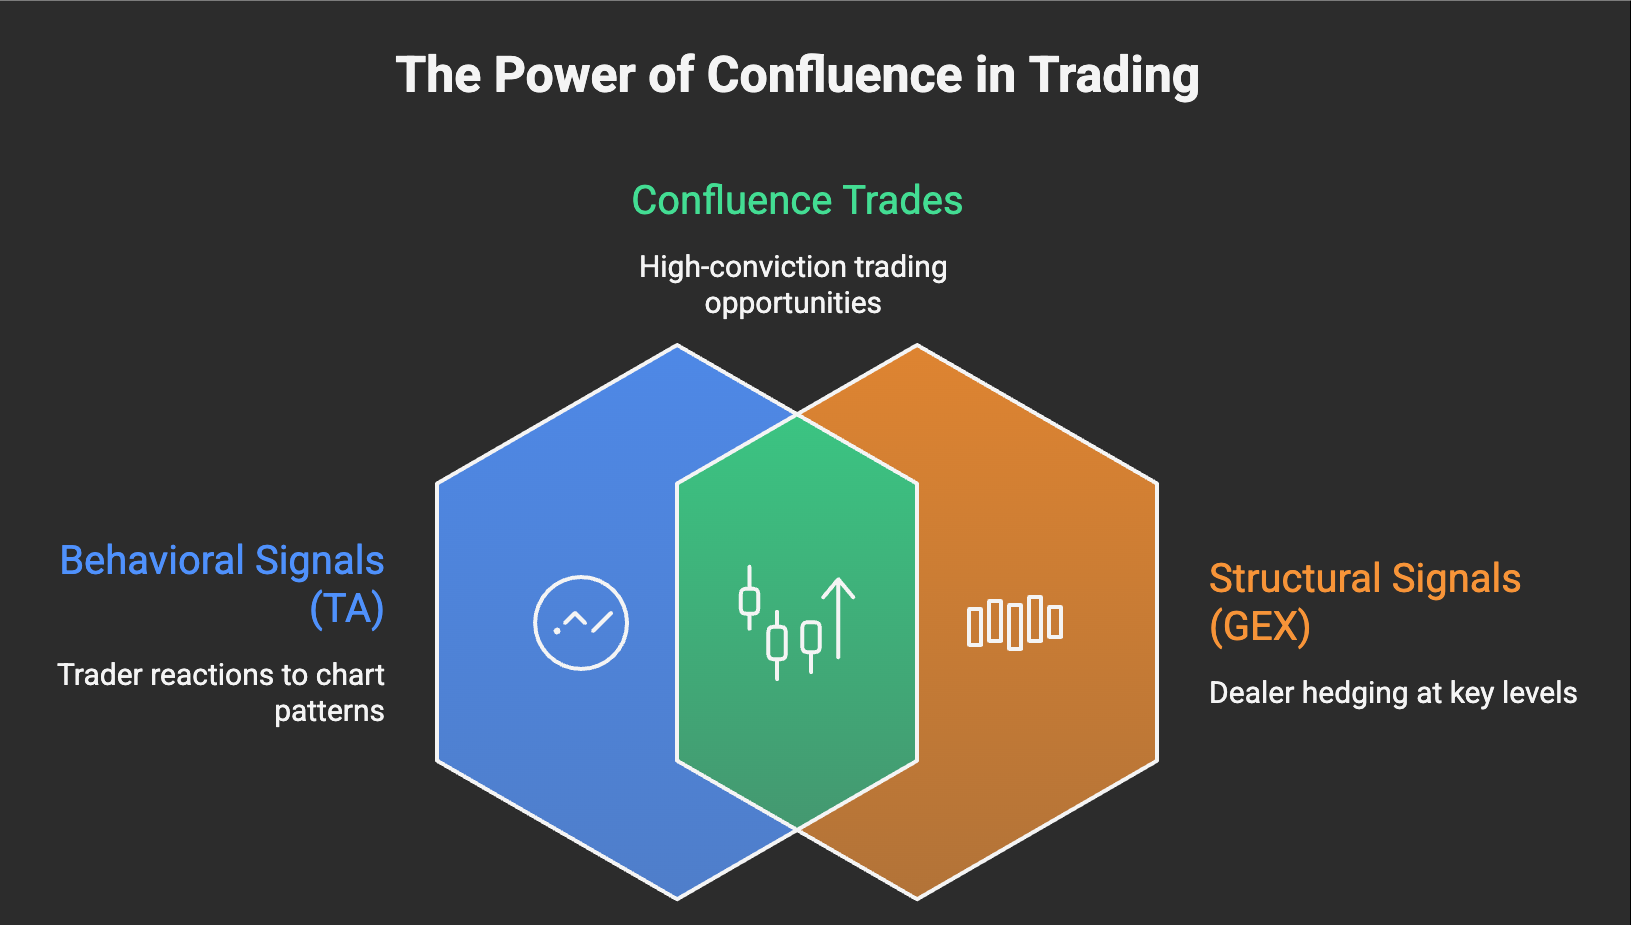
Think of TA and GEX as two different kinds of map of the same territory.
Your existing TA tells you where price has been and where traders are watching: trendlines, prior swing highs/lows, volume profile, RSI divergences. These are behavioral signals. They work because traders react to them.
GEX tells you where market structure is concentrated: walls, the Flip point, negative pockets. These are structural signals. They work because dealers have to hedge regardless of trader sentiment.
The two maps overlap but don't duplicate. The strongest setups happen when both maps point at the same level.
The 4-number layer
Four markers do most of the work:
- Flip point — your regime boundary
- P1 — the strongest stabilizing wall
- P2 — the closer secondary wall
- N1 — the nearest negative wall (your stop-loss reference)
GammaFlip's OHLC view already overlays all four on the candle chart for you. Open the app, switch the chart to Day or 1H mode, and you get this:
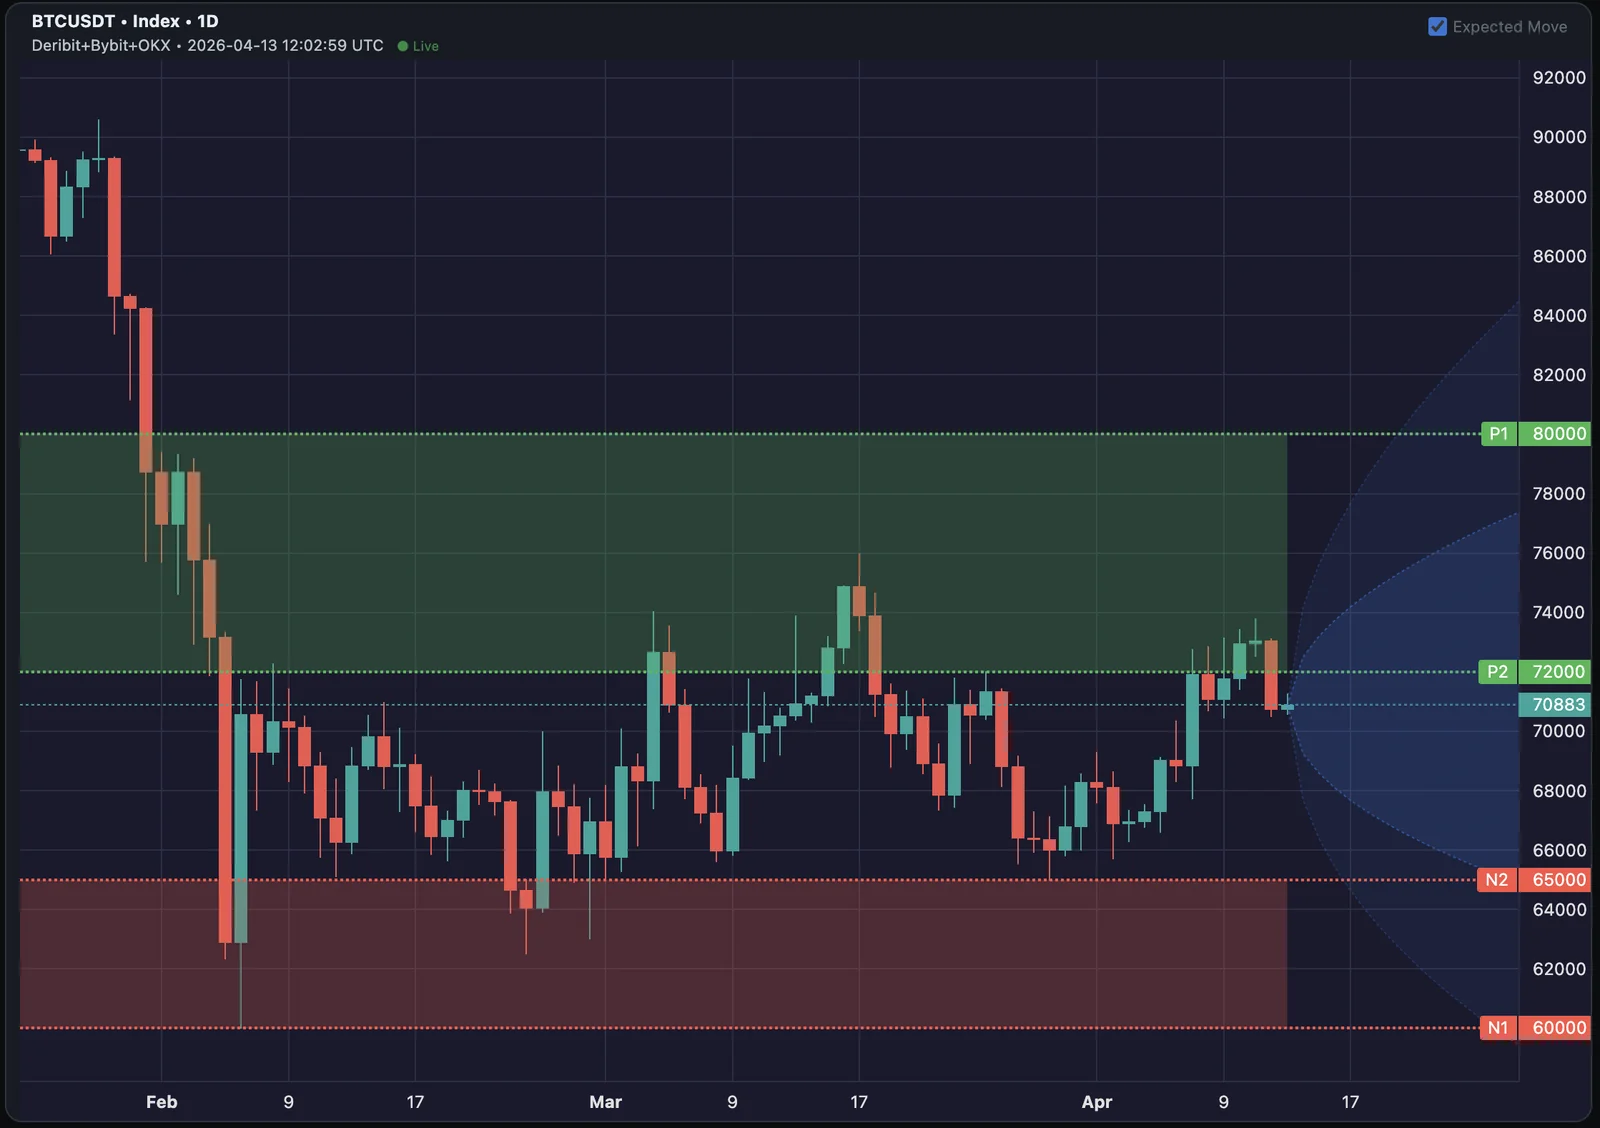
What you're looking at:
- Horizontal dashed lines — the GEX walls (P1/P2 in green, N1/N2 in red), with shaded green and red zones marking the stabilizing and volatile bands.
- Blue cone projecting forward from current price — the Expected Move (covered next).
The Expected Move cone
The blue cone is a probability range for where price is implied to land over the cone's forward window. It's derived from at-the-money implied volatility (IV — the market's forward-looking volatility estimate, ≈30 days-to-expiration in TOTAL mode) — so it's another structural signal, like GEX, not behavioral.
- Inner cone = ±1σ, roughly 68% probability of staying inside
- Outer cone = ±2σ, roughly 95% probability of staying inside
The walls tell you where price will react. The cone tells you whether price has the implied juice to reach a level within the window.
How to use it alongside GEX walls and your TA:
- GEX wall sits inside the cone → realistic target/entry in this timeframe. High-quality level to plan around.
- GEX wall sits outside the cone → real structural level, but unlikely to test in this window. Park it; don't anchor your trade plan to it.
- Your TA target outside the cone → you're betting on an outlier move, even if the level looks clean on the price chart. Size accordingly or wait for IV to expand.
Toggle the cone on/off via the Expected Move checkbox in the top-right of the OHLC chart.
The three patterns: confluence, disagreement, stealth
Now mentally (or in TradingView) overlay your own TA — trendlines, prior swing highs/lows, range edges — on top of the same chart. Three patterns will jump out:
- Confluence — your TA level sits within ~0.5% of a GEX line (about $400 on BTC at $80K, $10 on ETH at $2K). They're effectively the same level → high-conviction zone.
- Disagreement — your TA level is isolated, no GEX line within ~0.5% → tactical only, smaller size.
- Stealth — GEX line with no TA level nearby → still actionable, but invisible to traders watching only price action.
Cross-check each match against the cone. A confluence zone inside the cone is the highest-quality setup you'll find; a confluence zone outside the cone is real but probably not in play this week.
The "stealth level" advantage
The third pattern is the most interesting one. A P1 wall at a strike no chart trader has marked is still real. Price will react there. But it's invisible to anyone not running GEX.
That's the structural edge. You're seeing forces other traders aren't.
The classic example: a perp range trader who sees price grinding sideways with no clear technical resistance overhead suddenly hits a wall they didn't expect. Looking at GEX after the fact, P1 was right where price stalled — they just couldn't see it because their chart didn't show it.
Liquidation maps + GEX
If you use a liquidation heatmap (Coinglass, Hyblock, etc.), it pairs naturally with GEX.
- Liq cluster + N1 below current price = double trigger zone. A break of either accelerates the other. Stops below this combined zone, not above it.
- Liq cluster + P1 above current price = double resistance zone. Strong take-profit zone for longs.
- Liq cluster ONLY (no GEX wall) = tactical level, but no structural backing. Treat as one signal.
The GEX wall tells you the move is structurally supported. The liq cluster tells you the move will accelerate via forced selling/buying. Both together is the highest-conviction breakout setup you'll find.
Volume profile + GEX
Volume profile shows where price has traded the most. GEX shows where dealers have positioned the most. These often align — high-volume nodes tend to attract options activity — but when they diverge, it's worth noting.
The most useful pairing:
- Volume node + P1 wall at the same level = high-conviction support/resistance, even if the level looks unremarkable on a price chart alone
- Low-volume gap + N1 below = a breakdown there is structurally amplified by both factors. Expect rapid moves.
A two-minute pre-trade routine
Bake GEX into your pre-trade checklist. Two minutes max:
- Open GammaFlip → OHLC view. The 4 lines (Flip / P1 / P2 / N1) are already on the candles.
- Identify your trade idea using your normal process.
- Check: is your entry near a GEX line? Stop near N1? Target near P1/P2?
- If yes to most → full size. If not → half size or skip.
This isn't a different trading strategy. It's a structural filter on the strategies you already use.
Common pitfalls
A few things to avoid when adding GEX to your workflow:
- Don't replace your TA — augment it. GEX is a structural layer. Without your existing pattern recognition, you'll over-trade structurally interesting levels that have no behavioral confirmation.
- Don't trade off GEX in jumpy regimes the way you would in sticky. The TA-GEX confluence rule still applies, but mean-reversion logic gets weaker; momentum logic dominates. Adjust accordingly.
- Don't watch every marker — pick 4 and stick with them. Flip / P1 / P2 / N1 covers 80% of decisions. Adding A1/A2, S, V, etc. is useful but turns the chart into noise if you're not specifically using them for a setup.
Quick mnemonic
GEX doesn't replace your chart. It tells you which levels on it have structure behind them.
The traders who get the most out of GEX aren't the ones who throw out their TA. They're the ones who use GEX to grade which TA setups are worth betting on.
Next lesson: how Friday's settlement reshapes the chart — and why the GEX picture you trusted on Thursday looks different on Monday.
Check your understanding
Your trendline support sits at $93,200. P1 is at $93,000 and there's a liquidation cluster at $93,100. The GEX regime is sticky. How does this change your trade plan?
Three independent signals all clustered within $200. That's strong confluence: structural support (P1) + technical support (your trendline) + liquidation backstop. Long entries here have meaningfully higher conviction than acting on any one signal alone. Tight stop below the cluster makes the asymmetric setup work.
You drew a horizontal resistance at $98,500 from prior price action. The nearest GEX wall is P2 at $97,800. They don't line up. Do you still trust your resistance level?
Yes — but with weaker conviction. Your TA level is real, but it doesn't have GEX confluence behind it. Treat it as a tactical level (size accordingly), and watch P2 at $97,800 as a competing structural level. Whichever one price reacts to first tells you which the market is respecting today.
What's the simplest way to use GEX context with your existing chart workflow?
Open GammaFlip's OHLC view (chart → Day or 1H). Flip / P1 / P2 / N1 are already drawn on the candles — that's your GEX context layer, no manual setup. Compare your own TA levels to the lines on the chart: confluence = full size, isolated TA level = smaller size or skip. If you prefer TradingView, copy those 4 numbers across as horizontal lines once per session.
Your TA shows a clean swing target at $76,000 and P1 sits at $80,000 — but both sit *outside* the Expected Move cone for a 1-week trade. What does that mean for the plan?
Both levels are real, but the cone says IV is implying price stays inside a tighter band over the next week — neither is probabilistically in play. Either shorten the timeframe and pick a target inside the current cone, wait for IV to expand (which widens the cone), or skip. A confluence zone is only high-quality when it's a level price can realistically reach; outside-cone walls are still good to know about, but don't anchor this week's trade plan to them.