The Friday reset
Know why the GEX picture looks different on Monday than it did on Thursday — and how to read the chart through the weekly cycle.
There's a moment that surprises every new GEX user: you spend Thursday studying the chart, marking levels, planning trades for Friday — and then Monday morning the chart looks like a different asset.
Walls moved. The Flip point shifted. Markers you trusted are gone or rearranged.
You didn't misread anything. The chart got reset. Friday's 08:00 UTC settlement is a structural event that rebuilds the GEX picture from scratch.
This lesson covers what's actually happening, when to trust your levels, and how to trade through the weekly cycle.
What happens at Friday settlement
Crypto options on Deribit (and most other venues) come in four expiration buckets, all settling at 08:00 UTC:
- Daily — settle every day. Lower volume than the others; act as a small constant heartbeat.
- Weekly — settle every Friday. The biggest regular structural event.
- Monthly — settle on the last Friday of the month, on top of that day's weeklies.
- Quarterly — settle on the last Friday of the quarter, on top of monthlies + weeklies.
So Friday at 08:00 UTC is the universal settlement moment for weeklies, monthlies (when it's month-end) and quarterlies (when it's quarter-end). When it lands, every contract whose settlement was that Friday closes out and disappears from the open interest picture.
GEX is computed from open contracts. Once those contracts settle, they're gone from the calculation. The strikes they were concentrated at no longer have the structural pressure they did 24 hours earlier.
Concretely: a P1 wall on Thursday afternoon could be 70% driven by Friday's settling weeklies. After settlement, those contracts vanish. P1 might shift to a completely different strike — wherever the next batch of open positions is concentrated.
How big is the slice that vanishes? The Term Structure chart (the Expiry tab) answers that directly. It plots ABS GEX per expiration as stacked bars, exchange by exchange, so you can see the relative weight each expiration carries in the Combined picture.
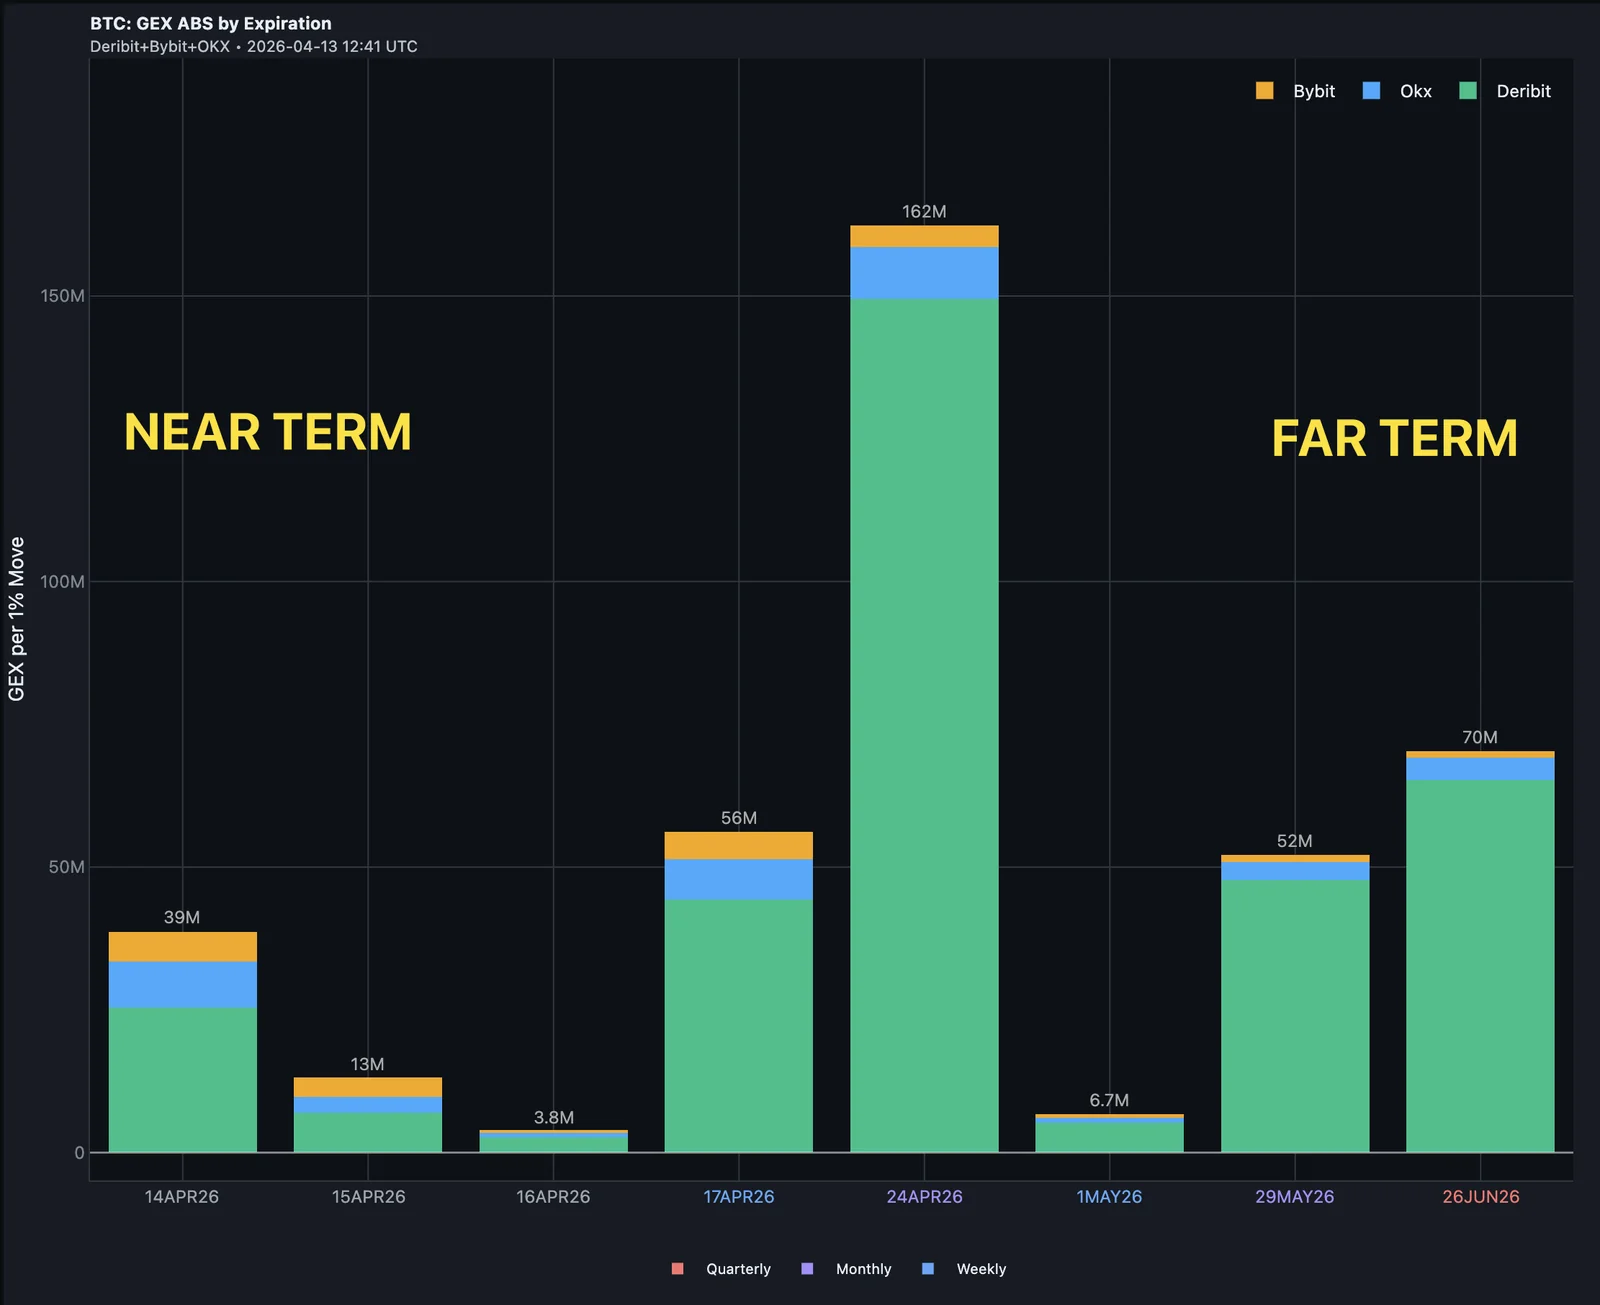
The columns map onto the bucket list above — the colored x-axis labels mark which is which (blue = weekly, purple = monthly, red = quarterly; uncolored = daily). When the front-dated columns are a large fraction of the total, the Friday reset is structural, not cosmetic — that's the share of GEX that disappears at 08:00 UTC.
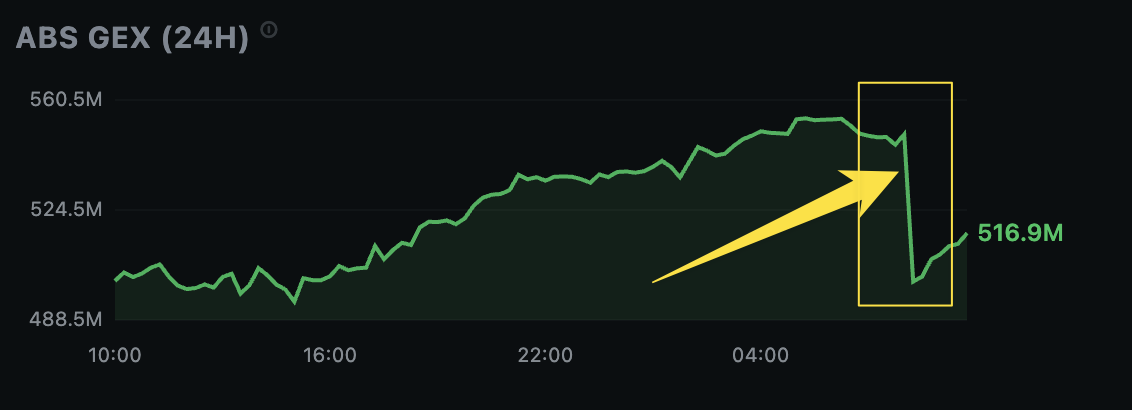
You can also watch the resets land in real time on the dashboard's ABS GEX (24h) timeline: small steps at 08:00 UTC every day as dailies settle, and a noticeably larger step on Friday as weeklies settle on top.
The weekly rhythm
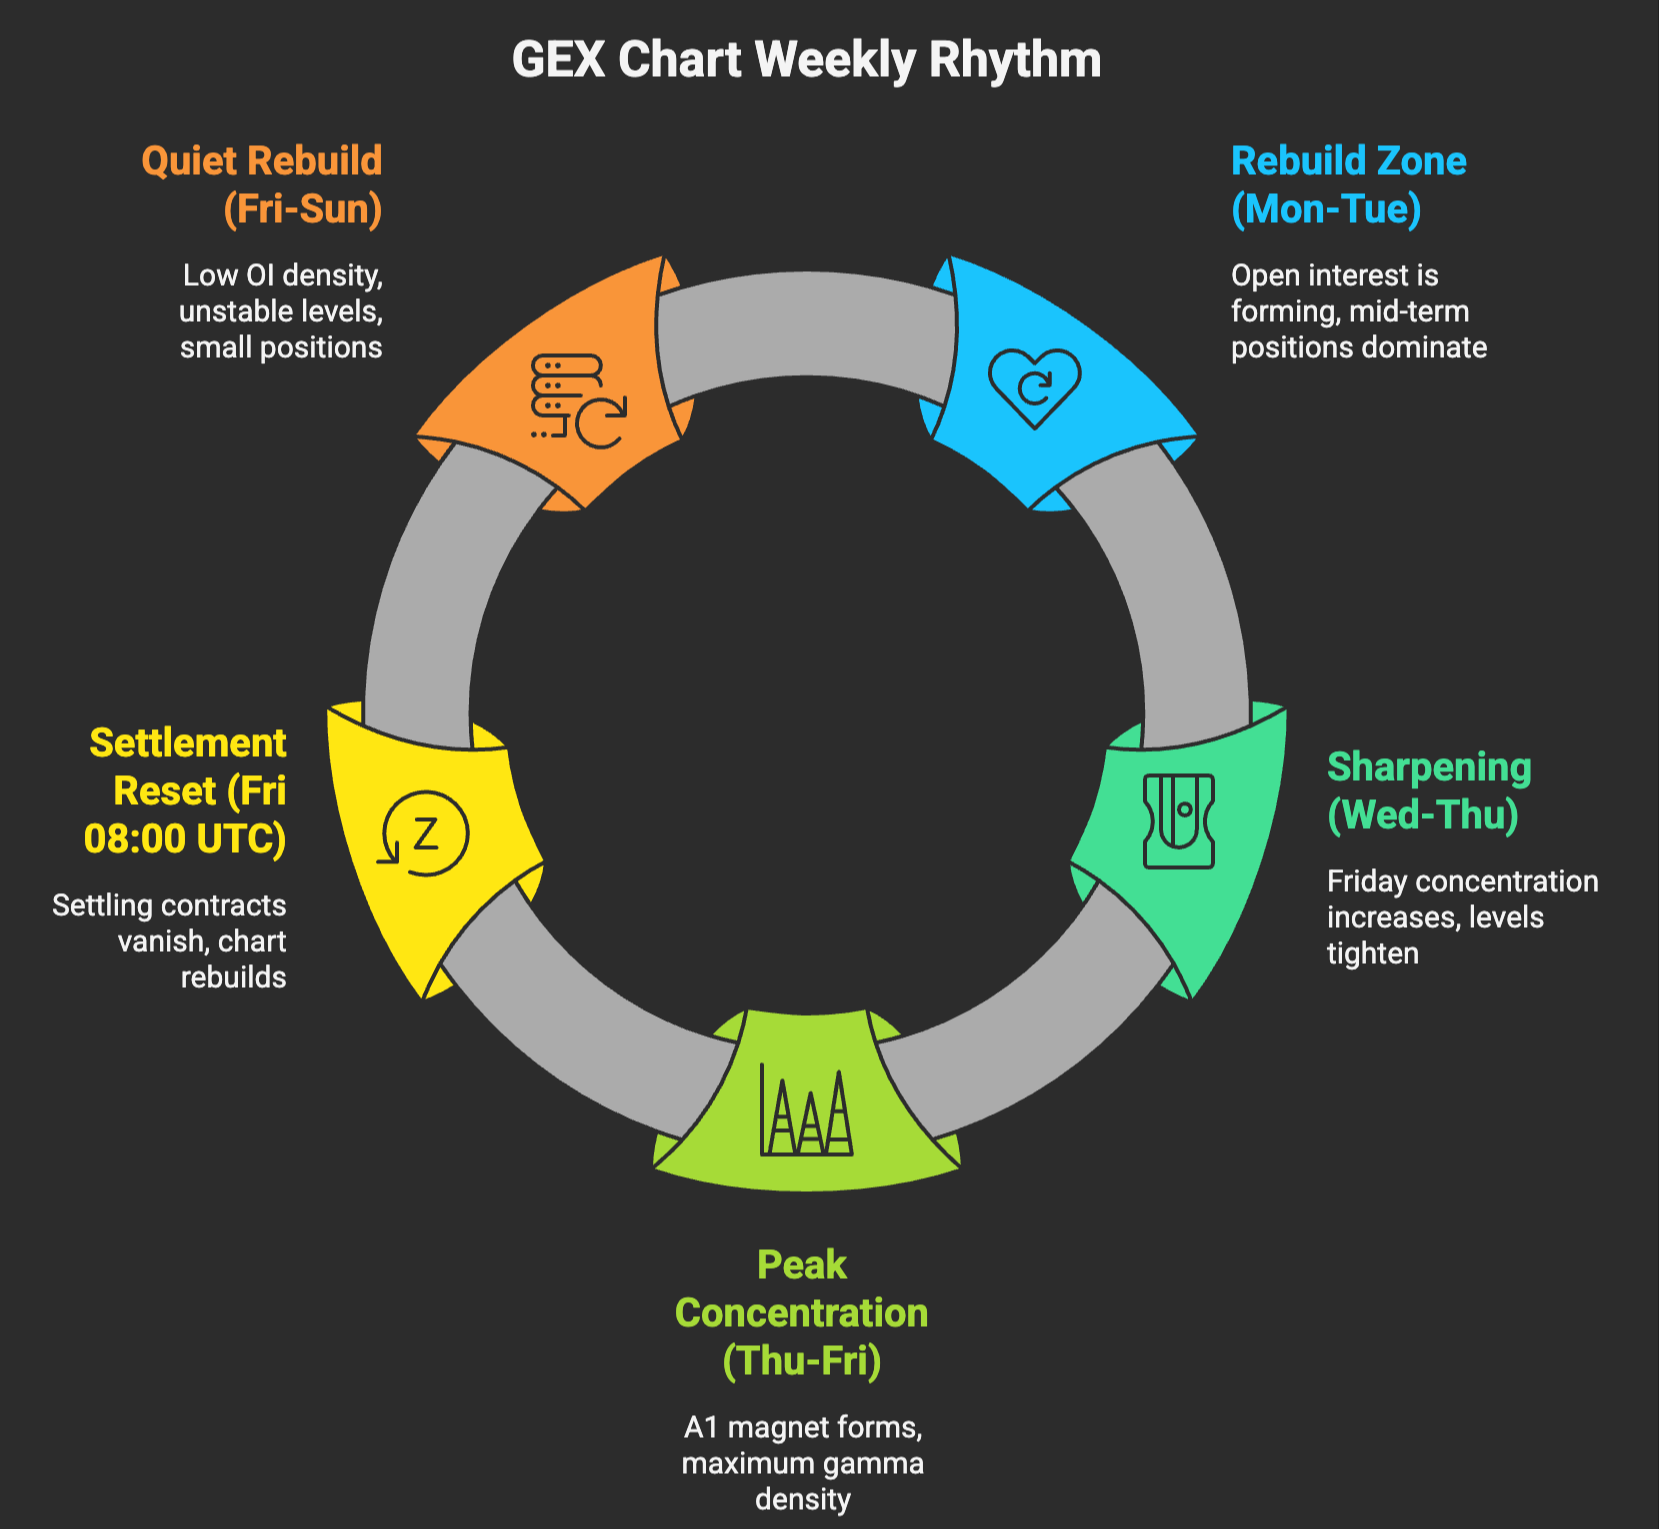
The chart breathes on a weekly cycle. Once you see the rhythm, the resets stop feeling random.
Monday-Tuesday: The new picture stabilizes. Open interest is rebuilding for the next Friday. Levels driven by the new settlement cycle haven't fully formed yet. Mid-week and longer-dated open positions dominate the chart.
Wednesday-Thursday: The Friday concentration starts to dominate. P1, P2, and N1 increasingly reflect Friday's strikes. The chart sharpens — levels look "tighter" because activity is funneling into the next settlement.
Thursday afternoon - Friday morning: Peak Friday concentration. A1 starts magnetizing price (you saw this in Lesson 5). The strongest pinning setups are here.
Friday 08:00 UTC settlement: Reset. Contracts vanish. Chart rebuilds.
Friday afternoon - Sunday: New picture forms slowly as positioning shifts toward the next Friday. Lower OI overall; levels are less reliable until Monday-Tuesday.
How to read levels through the cycle
The practical rule: a level's reliability depends on which timeframe of open interest is driving it.
- A wall driven mostly by this Friday's open positions has a 24-72 hour shelf life. Trade it tactically; don't build a multi-day position around it.
- A wall driven mostly by next month's or next quarter's open positions has a much longer shelf life. These are your durable levels.
- A wall driven by both — a strike where short-dated and long-dated open interest both concentrate — is the most reliable level on the chart. It survives the weekly reset because the longer-dated open interest is still there Monday morning.
The Term Structure chart (the Expiry tab) helps you separate these. The x-axis lays out expirations from TOTAL/Combined on the left through the front-dated dailies, the next weekly, and the next monthly on the right. The green band traces P1/P2 across each expiration, the red band traces N1/N2, and the magenta line is the Gamma Flip.
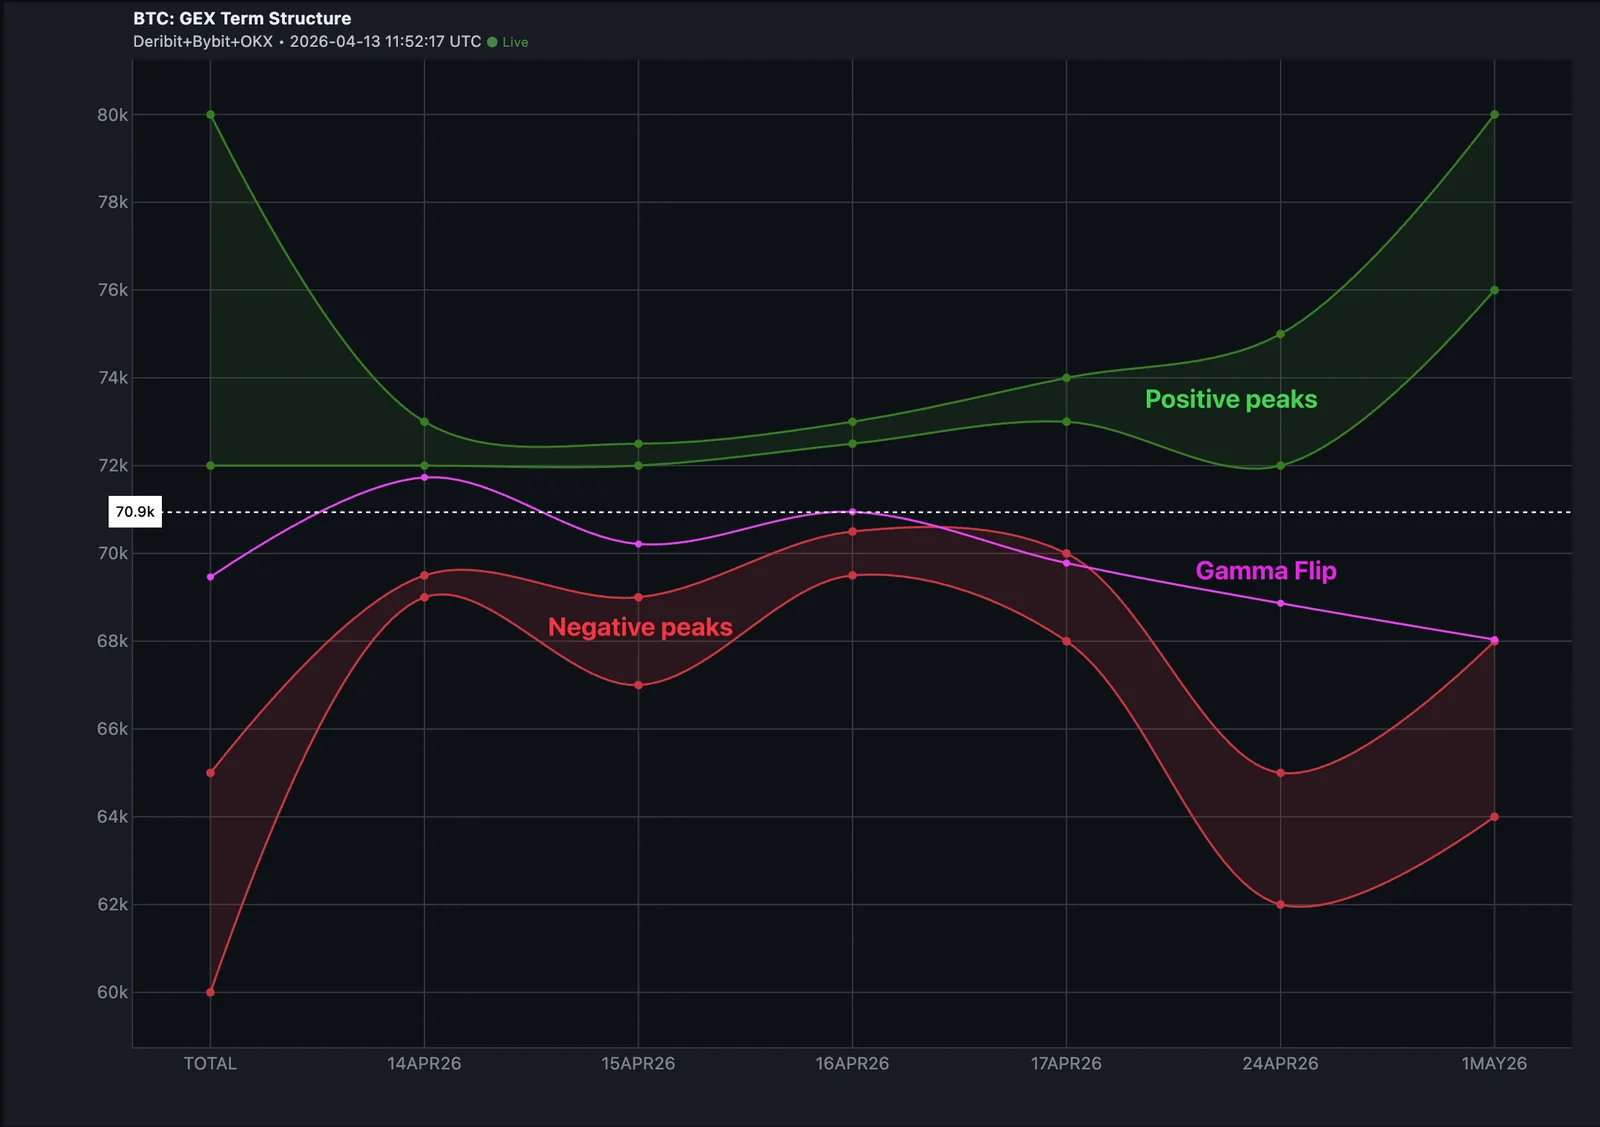
What to read from it:
- A level that holds at roughly the same price across TOTAL, the next weekly, and the next monthly is a durable structural level. Open interest at that strike persists past Friday's reset.
- A level that spikes only on a front-dated column (today's daily, this Friday's weekly) and isn't echoed further out is a short-term level — it'll probably evaporate at settlement.
- A Gamma Flip line that slopes meaningfully across expirations tells you the regime boundary itself is timeframe-dependent: the level you should treat as "today's flip" can differ from the one driving multi-week structure.
Practical implications
Don't anchor multi-day theses to short-dated walls. If you're planning a swing trade for next week, build it around longer-dated structure, not Friday's immediate concentration.
Take pre-Friday profits seriously. A1 pinning during Friday's final hours is one of the most reliable patterns on the chart. After settlement, it's gone. If you're holding a perp into Friday morning, your decision logic should reference A1, not your weekly TA setup.
Don't trade aggressively right after settlement. Friday afternoon and Saturday morning have low OI density and unstable levels. Wait for Monday-Tuesday for the new picture to settle. Position sizing should reflect this — smaller during the rebuild, larger as the cycle matures.
Month-end and quarter-end
The reset compounds at month-end and quarter-end:
- End-of-month Friday: monthly contracts also settle. Weekly + monthly OI both vanish at once — a much larger reset than a normal Friday.
- End-of-quarter Friday: quarterlies settle on top of monthlies and weeklies. The biggest reset event of the cycle. The chart can shift dramatically. Some of the strongest A1 pins of the year happen here, followed by the most disorienting Monday-morning charts.
Mark these on your calendar. They're the days when "what's the chart telling me" is least useful and "where's the magnet for today" is most useful.
Quick mnemonic
Friday rebuilds the chart. Short-dated walls are 24-hour signals; long-dated walls are the steady frame.
The traders who get burned by GEX after a few weeks of using it are the ones who don't internalize the weekly cycle. Walls aren't permanent — they're snapshots of an OI picture that resets every seven days. Plan accordingly.
Next lesson: when to ignore GEX entirely — the conditions where the structural read fails, and what to do instead.
Check your understanding
It's Monday morning. The chart looks completely different from how you read it Friday afternoon. Walls have shifted, the Flip point has moved $1,500. What's going on?
Friday's settlement removed all the contracts that expired. Monday's chart is built from a fresh set of open positions — newer expirations now drive the picture. This isn't a reading error or a glitch. It's the weekly reset. Your Thursday levels aren't wrong; they're just no longer the ones that matter.
It's Thursday at 3 PM UTC. P1 has been at $96,000 for the past three days. How much should you trust that level for a Friday-morning trade?
Less than you'd think. Thursday-evening P1 is built mostly from contracts that will expire 17 hours later. After Friday 08:00 UTC settlement, the chart will rebuild from the next batch of open positions. Use Thursday's P1 for short-term setups; don't anchor a multi-day thesis to it.
What's the most reliable level to watch on Tuesday or Wednesday — the start of a new weekly cycle?
Levels driven by positions beyond the immediate Friday — typically the next monthly or quarterly. These have larger open interest, more time to rebuild concentration, and are less affected by the weekly reset. The chart's near-term levels can be noisy mid-week; the longer-dated structure is steadier.