GEX Asymmetry: Reading Market Structure Like a Pro
Question: Why does Bitcoin sometimes feel like it's swimming through concrete on the upside, while other times it rockets through resistance like paper?
Answer: Look at the gamma asymmetry. It's showing you where the hedging "weight" sits.
Most traders know about gamma exposure (GEX) and flip points. But there's a deeper layer: how much hedging pressure exists above vs below current price. This asymmetry reveals whether market makers' hedging flows will fight your directional bet or fuel it.
TL;DR: Asymmetry metrics tell you if the path of least resistance is up, down, or nowhere. Master these three numbers—Upside GEX, Downside GEX, and Ratio—and you'll trade structure, not hope.
Real-World Example: Reading the Structure
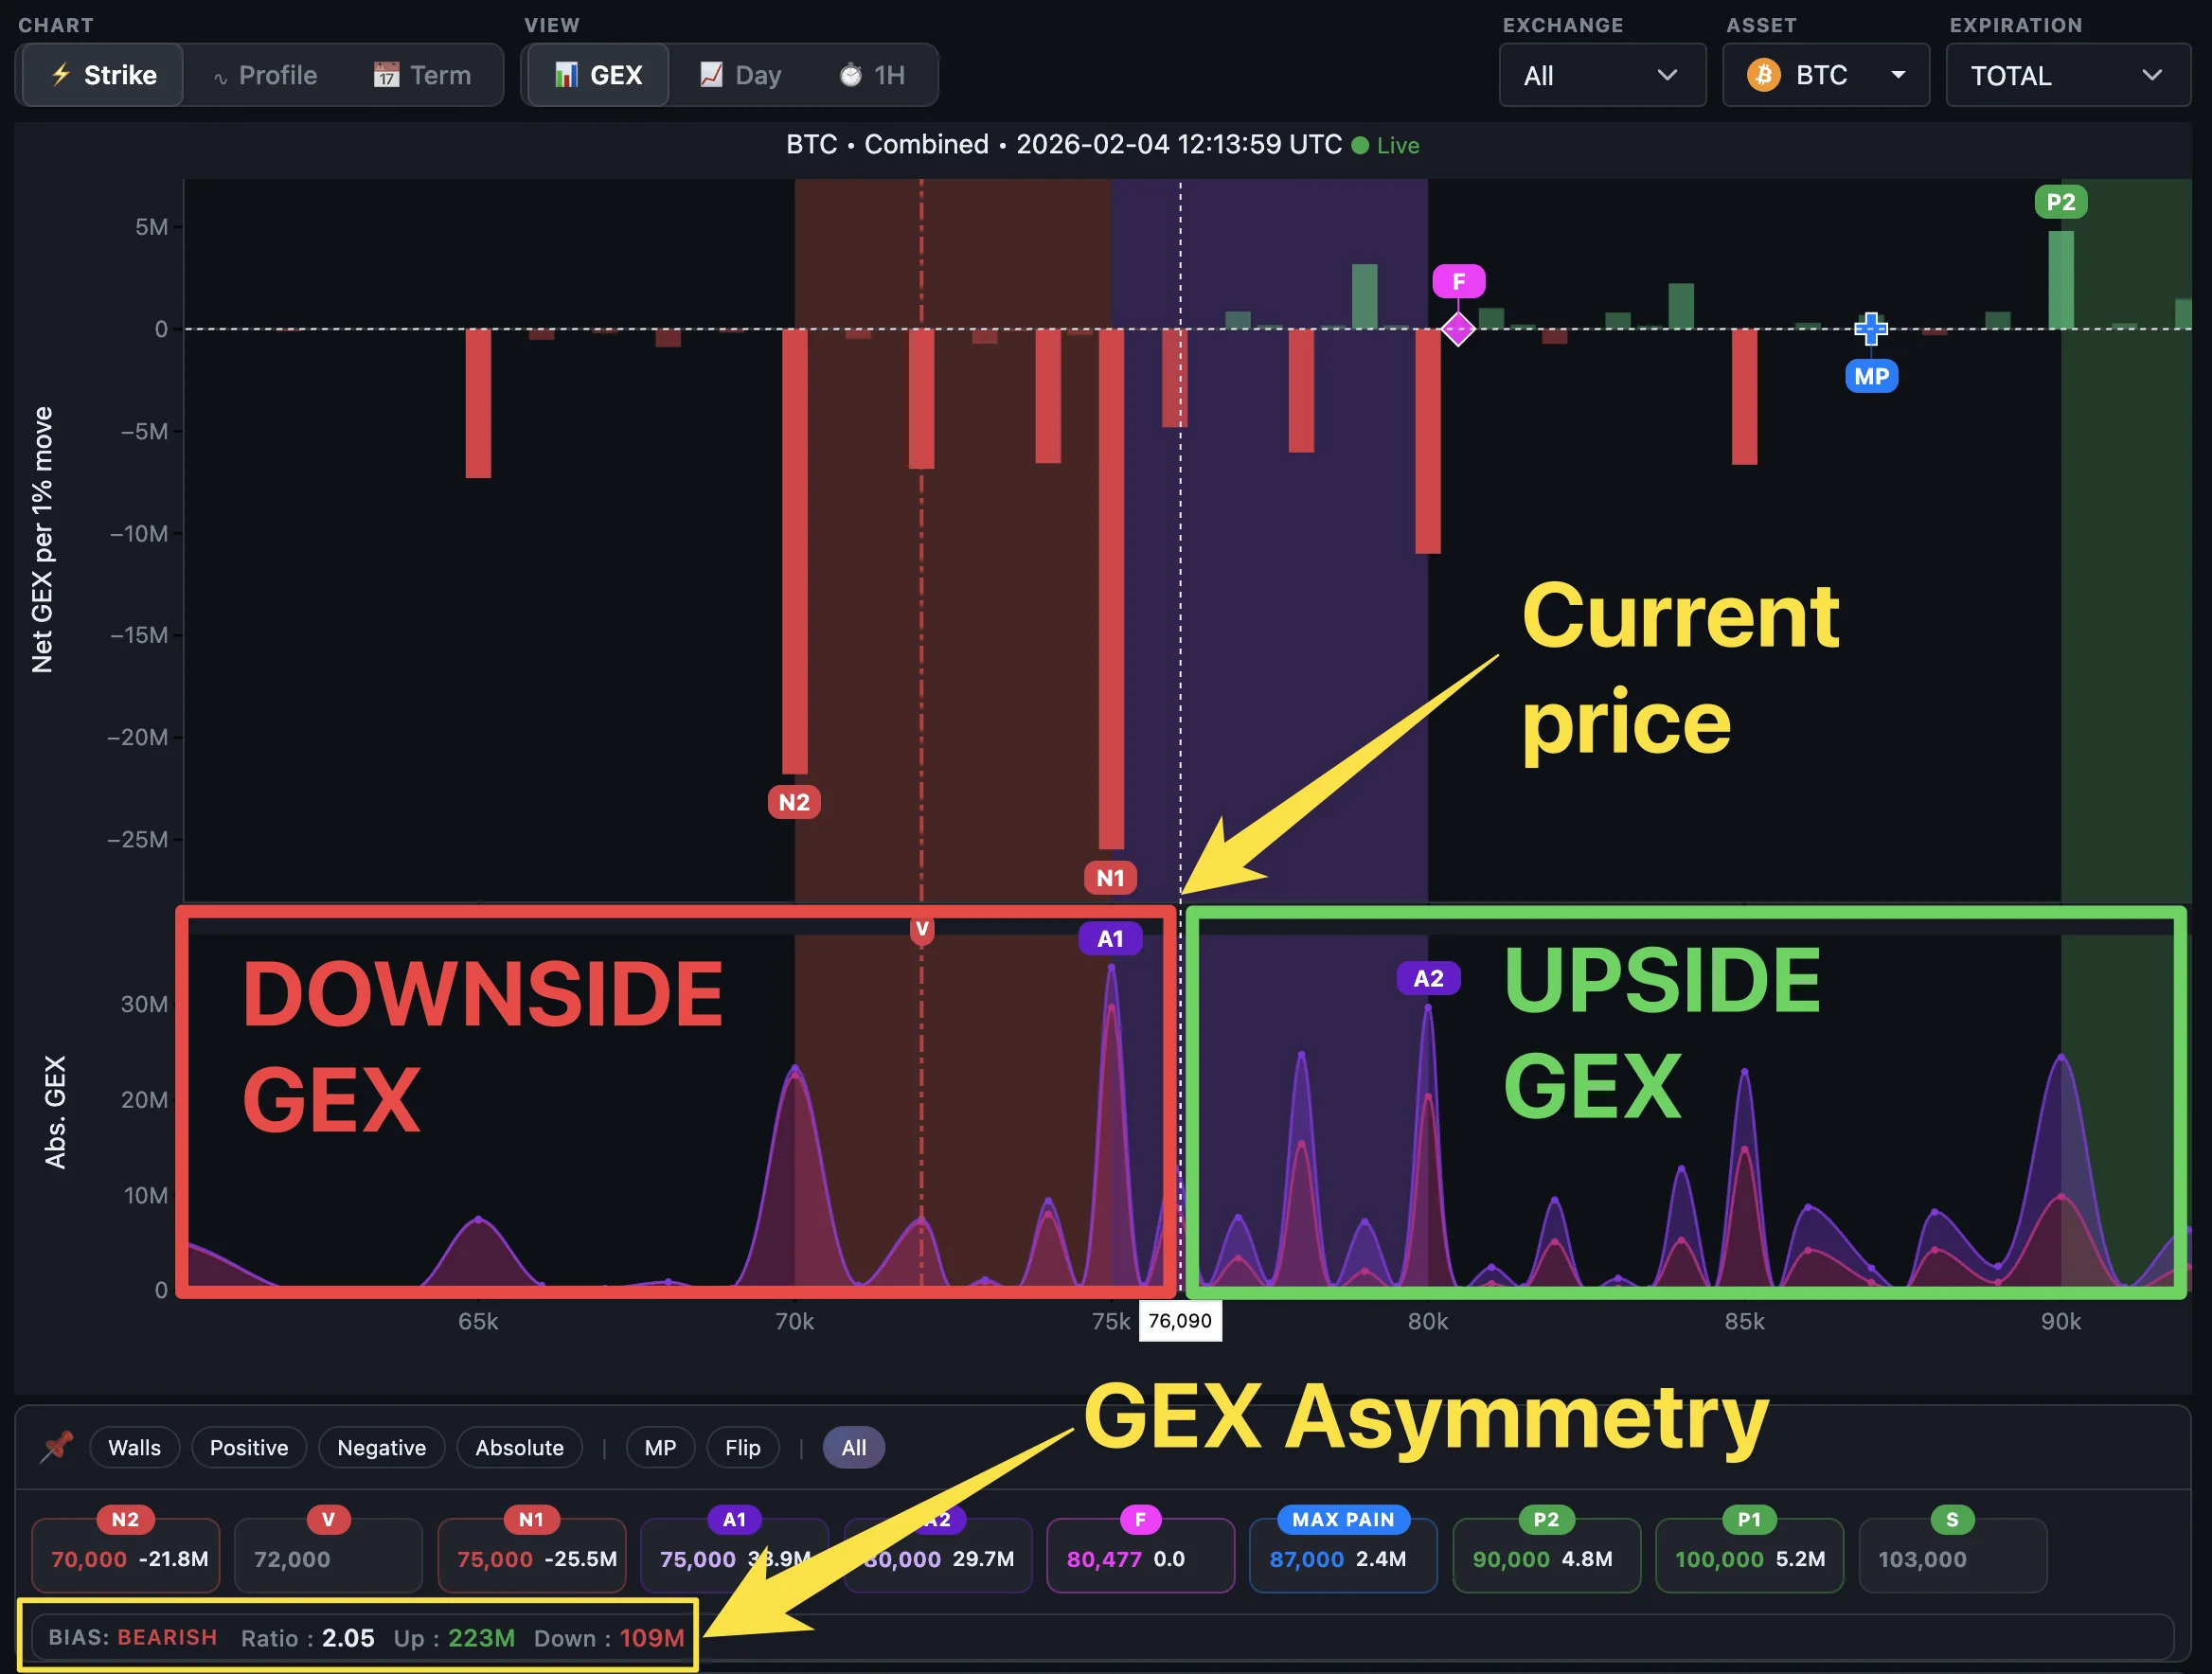 Example: BTC facing high Upside GEX—Ratio 2.04 creates natural resistance
Bearish Bias (Ratio > 1.5) – The Concrete Ceiling
Setup:
What This Means: - Massive hedging obligations above ($80,000+ range) - Light hedging obligations below (weak structural support) - Path of least resistance: DOWN - Dealers must hedge more aggressively as price rises than as it falls
Risk Management: If price breaks resistance with strong volume, respect the move—structure can break. Hedging flows create friction, not absolute barriers.
The Three Core Metrics
When you view the GEX by Strike rotating panel, you'll see these numbers. In the example above:
- Upside GEX: 222M
- Downside GEX: 109M
- Ratio: 2.04
Let's decode exactly what these mean.
1. Upside GEX (Up) – Resistance Above
This is the sum of all absolute GEX from strikes above the current price.
Think of it as the total "hedging pressure" market makers must handle if price moves up. Higher Upside GEX means more hedging activity as price rises, creating structural resistance.
High Upside GEX (e.g., 200M+): - Heavy options positioning above current price - Dealers must actively hedge as price approaches these strikes - Creates resistance/"ceiling" effect - Upward moves face structural friction
Example: BTC at $60K with 250M Upside GEX means massive hedging obligations at higher strikes. As price climbs toward those levels, dealers must adjust their hedges, creating structural friction on the upside.
2. Downside GEX (Down) – Support Below
This is the sum of all absolute GEX from strikes at or below current price.
This represents the hedging pressure waiting below. Higher Downside GEX means more dealer activity if price falls, potentially providing support.
High Downside GEX (e.g., 150M+): - Heavy options positioning below current price - Dealers actively hedge on downward moves - Often acts as structural support - Can cushion sell-offs
Example: BTC at $58K with 180M Downside GEX at lower strikes suggests substantial hedging obligations below. As price falls toward those levels, dealer hedging activity tends to stabilize price, creating support.
3. Asymmetry Ratio – The Balance of Power
This is where it gets actionable:
Ratio = Upside GEX / Downside GEX
Both values use absolute GEX (already calculated in GEX by Strike). We're measuring the structural size of positioning above vs below—pure hedging volume, regardless of direction.
Interpretation:
| Ratio | Bias | Meaning |
|---|---|---|
| > 1.2 | BEARISH | More gamma resistance above → upside capped |
| 0.8 - 1.2 | NEUTRAL | Balanced structure → no directional edge |
| < 0.8 | BULLISH | More gamma support below → downside cushioned |
In our example, the Ratio of 2.04 tells you there's twice as much hedging pressure above than below. Price has a structural ceiling, not a floor.
How Is This Calculated?
- Start with GEX by Strike data: Each strike already has its
total_gexvalue (absolute sum of call + put GEX) - Current price split: Divide strikes into two groups based on current market price
- Sum each side:
- Upside GEX = Sum of
total_gexfor all strikes above current price - Downside GEX = Sum of
total_gexfor all strikes at/below current price - Calculate ratio: Upside GEX / Downside GEX → Asymmetry Ratio
Key point: Asymmetry is a snapshot measurement using current market data. We're asking: "Right now, at current price, how is the total hedging pressure distributed above vs below?"
Important distinction: We measure total hedging obligations (absolute GEX) for all strikes above/below current price. We don't differentiate between calls and puts—we simply know where the heaviest hedging activity will concentrate as price moves. A high Upside GEX could come from out-of-the-money calls, in-the-money puts, or a mix of both. What matters is the total pressure, not the option type.
The Open Interest Analogy (But Better)
You know open interest—it shows where contracts are clustered. But OI is passive. It's like counting how many spectators are at a game.
GEX Asymmetry is active. It measures how much force those spectators exert when they all lean in one direction.
| Metric | What It Shows | What It Misses |
|---|---|---|
| Open Interest | Where contracts exist | How much hedging pressure they create |
| GEX Asymmetry | Where hedging flows will concentrate | Individual trade details |
Visual analogy:
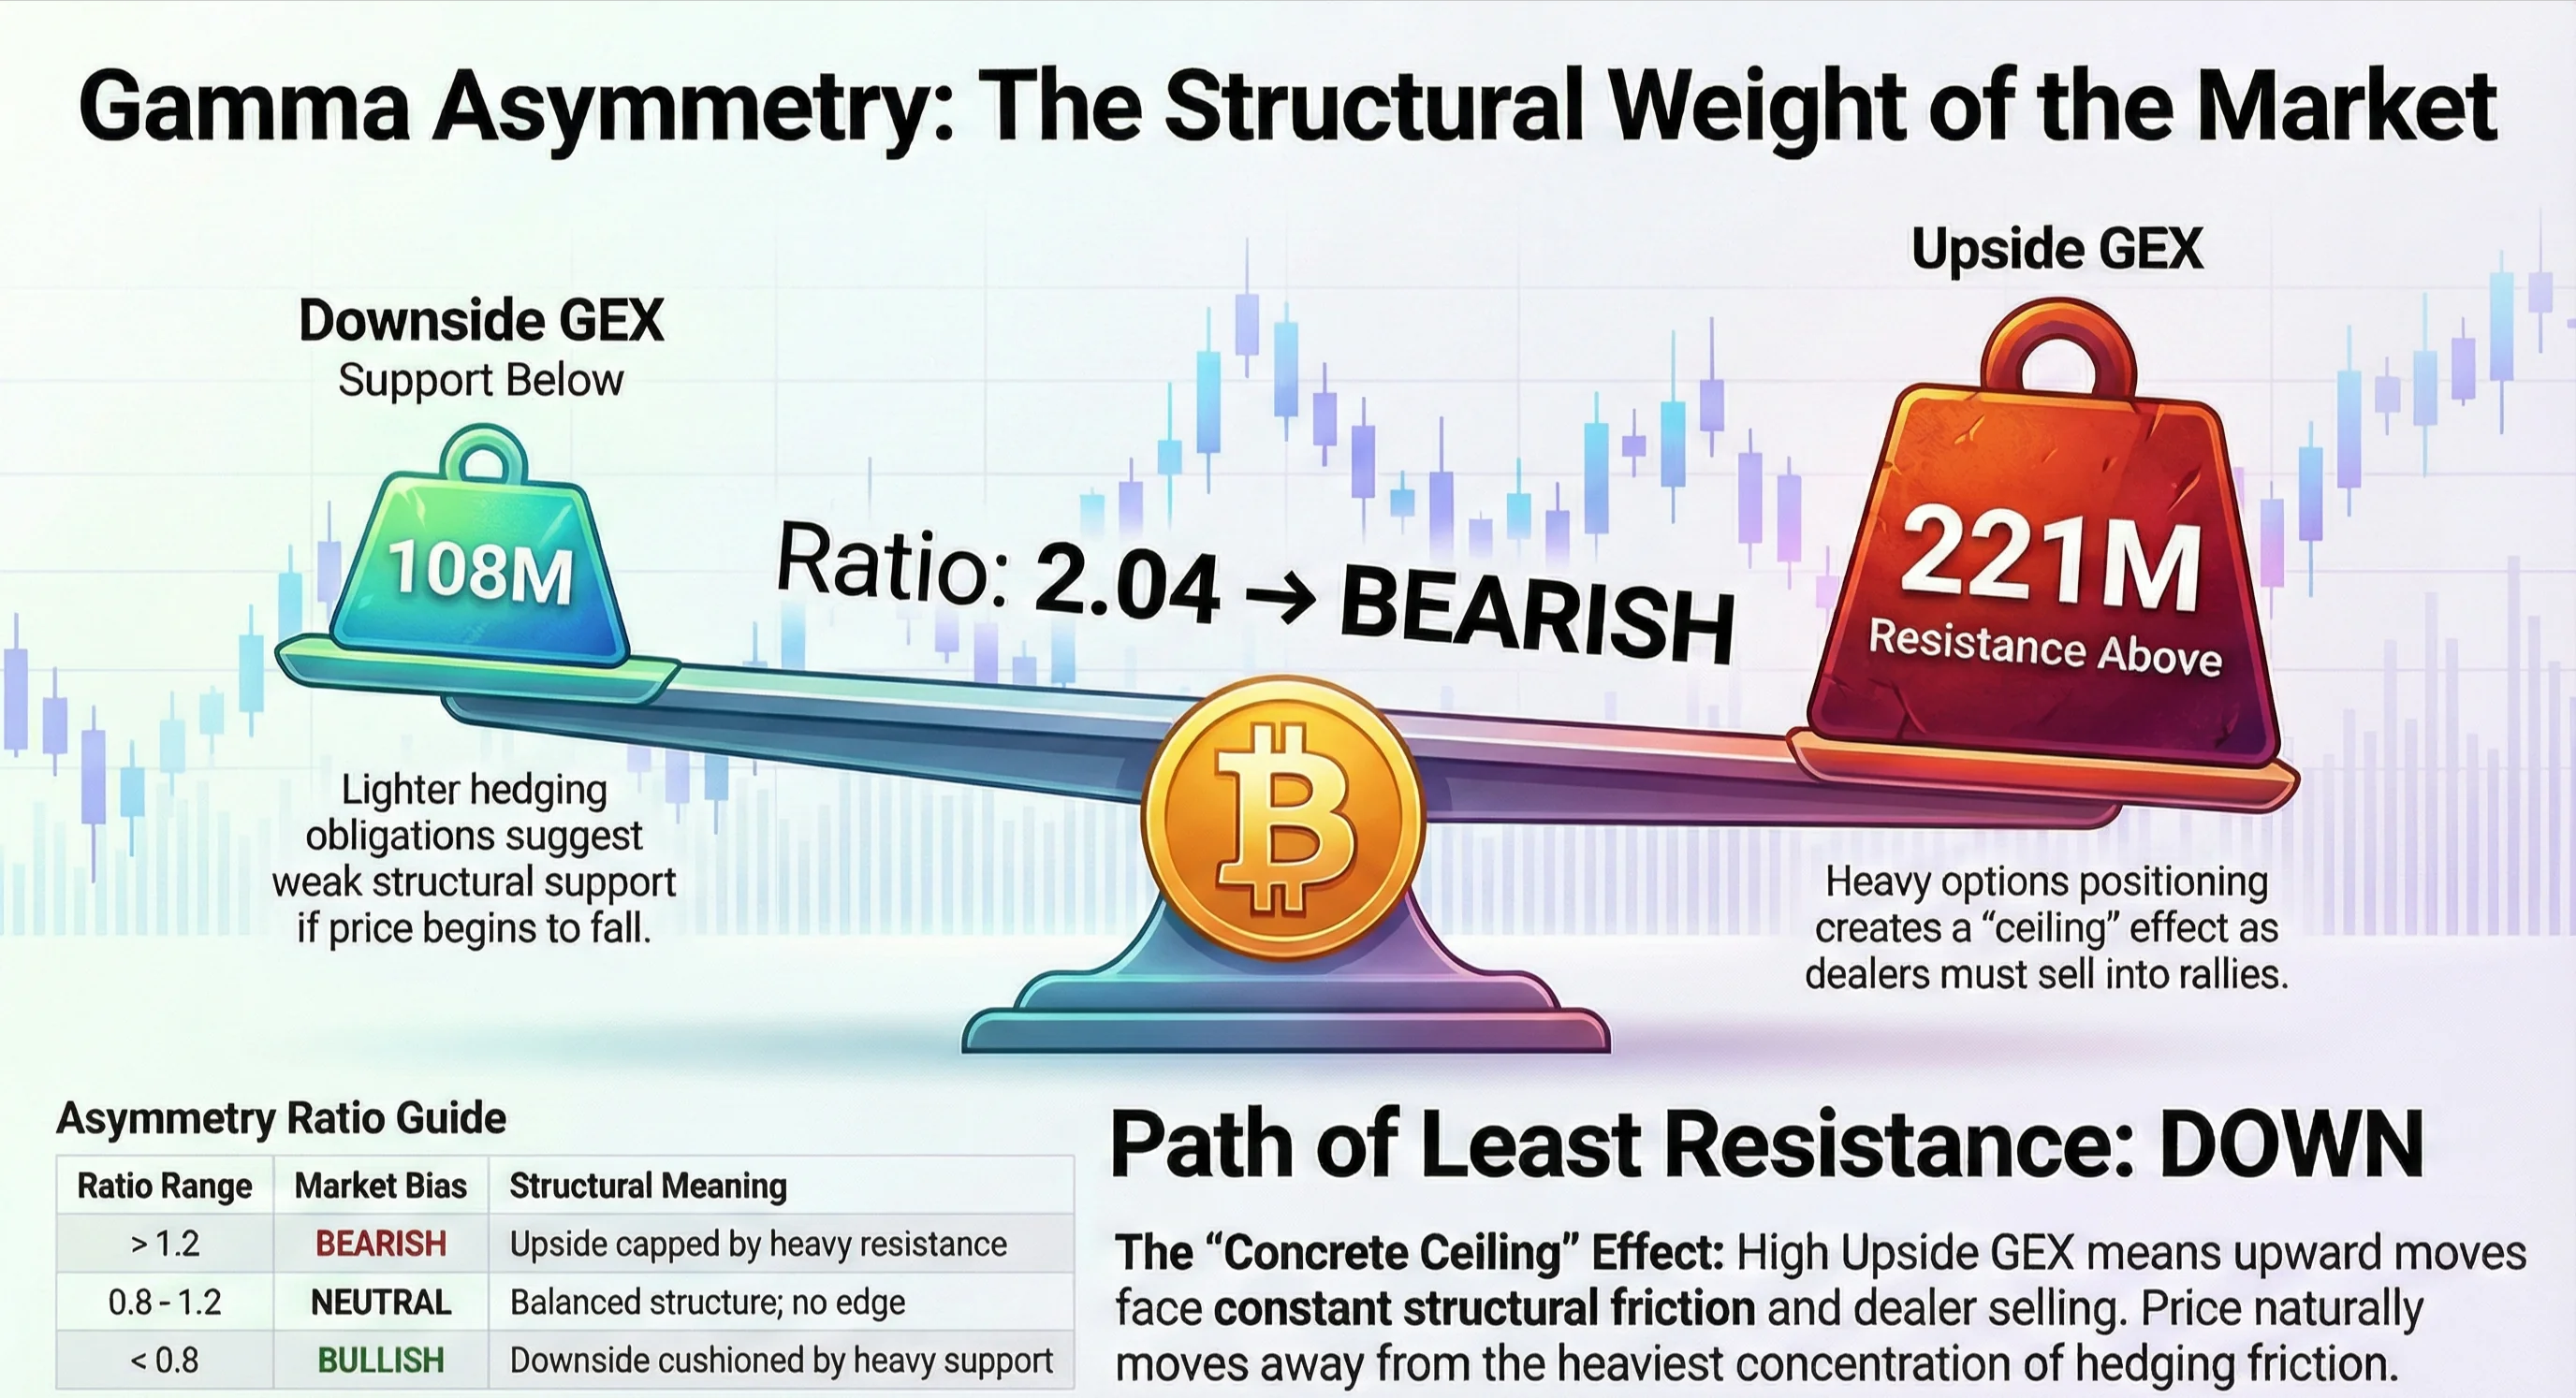
Imagine Bitcoin price as a ball balanced on a scale: - High Upside GEX = Heavy weight on the right side (pushing price down) - High Downside GEX = Heavy weight on the left side (supporting price) - Ratio > 2.0 = Scale tipped heavily to one side
When Upside GEX (222M) is double Downside GEX (109M), the scale tips right—price naturally wants to fall. You're fighting gravity to move it up.
Key Takeaways
- Upside/Downside GEX quantifies hedging pressure above and below current price
- Ratio > 1.2 = BEARISH (resistance above outweighs support below)
- Ratio < 0.8 = BULLISH (support below outweighs resistance above)
- Unlike open interest, GEX measures active hedging obligations, not passive positioning
- Trade with the asymmetry, not against it—fight gravity at your own risk
- Now grouped with GEX by Strike for intuitive snapshot analysis
- Simplified calculation ensures perfect consistency with Total GEX
- Best used in combination with technical levels, volume profile, and catalyst timing
The Bottom Line
Open Interest tells you where traders are positioned. Gamma Asymmetry tells you which way the hedging machine wants to push price.
Next time you see Bitcoin pinned below a level despite bullish news, check the Upside GEX. Chances are, you're staring at 200M+ of structural resistance—market makers' hedging flows acting like a ceiling.
The smart trade isn't fighting it. It's positioning for the bounce when price inevitably rolls back toward the Downside support zone.
Why Asymmetry Is Now on "GEX by Strike" tab
Important UI Update (Feb 2026): The Bias panel has been moved to the GEX by Strike tab.
Why? Because it makes more conceptual sense:
- GEX by Strike = Snapshot of current market state
- Shows where strikes are positioned RIGHT NOW
- Total GEX = snapshot metric (current hedging obligations)
- Bias/Asymmetry = snapshot metric (current pressure balance)
-
All three metrics answer: "What is the market structure at this moment?"
-
Gamma Profile = Forecast tool
- Models how gamma will change if price moves to different levels
- Shows future regime transitions
- Answers: "How will behavior change as price moves?"
This reorganization groups snapshot metrics together (Total GEX + Bias), separating them from forecast tools (Gamma Profile + dynamic modeling). The result: clearer mental models and faster decision-making.
You'll now find Bias in the rotating panel on GEX by Strike, cycling with Total GEX and Max Pain.
Want to see this in action? Open the GEX by Strike view and watch the rotating panel. You'll start seeing the market's invisible structure—and that changes everything.
Disclaimer: This article is for educational purposes only. Gamma asymmetry analysis involves assumptions about market maker positioning and is not a guarantee of future price movement. Always manage risk appropriately and combine multiple analysis methods. Options trading carries significant risk.
Ready to see GEX in action?
Try GammaFlip.io and experience professional-grade gamma exposure analysis
Launch App