GEX Heatmap: Visualizing Gamma Exposure Over Time
What if you could see every gamma shift across every strike over the last 24 hours — in a single image?
That's the GEX Heatmap. No scrolling through snapshots, no mental interpolation between timestamps. Just a 2D matrix of Time × Strike, colored by gamma exposure intensity, with the actual price path drawn right on top.
What the Heatmap Shows
The heatmap plots gamma exposure per strike across a time axis. Each cell represents the GEX value at a given strike and timestamp. The color tells you the magnitude — and in Net GEX mode, the direction.
Two metrics are available:
Net GEX
Net GEX distinguishes between stabilizing and amplifying zones:
- Green = Positive GEX — dealers buy dips and sell rallies here, compressing volatility
- Red = Negative GEX — dealers amplify moves in both directions, expanding volatility
- White/Neutral = Near-zero gamma — no meaningful hedging pressure
The Net GEX heatmap is your regime map. Green bands act as walls — price tends to slow down or reverse when it enters them. Red bands are acceleration zones — price moves faster through them.
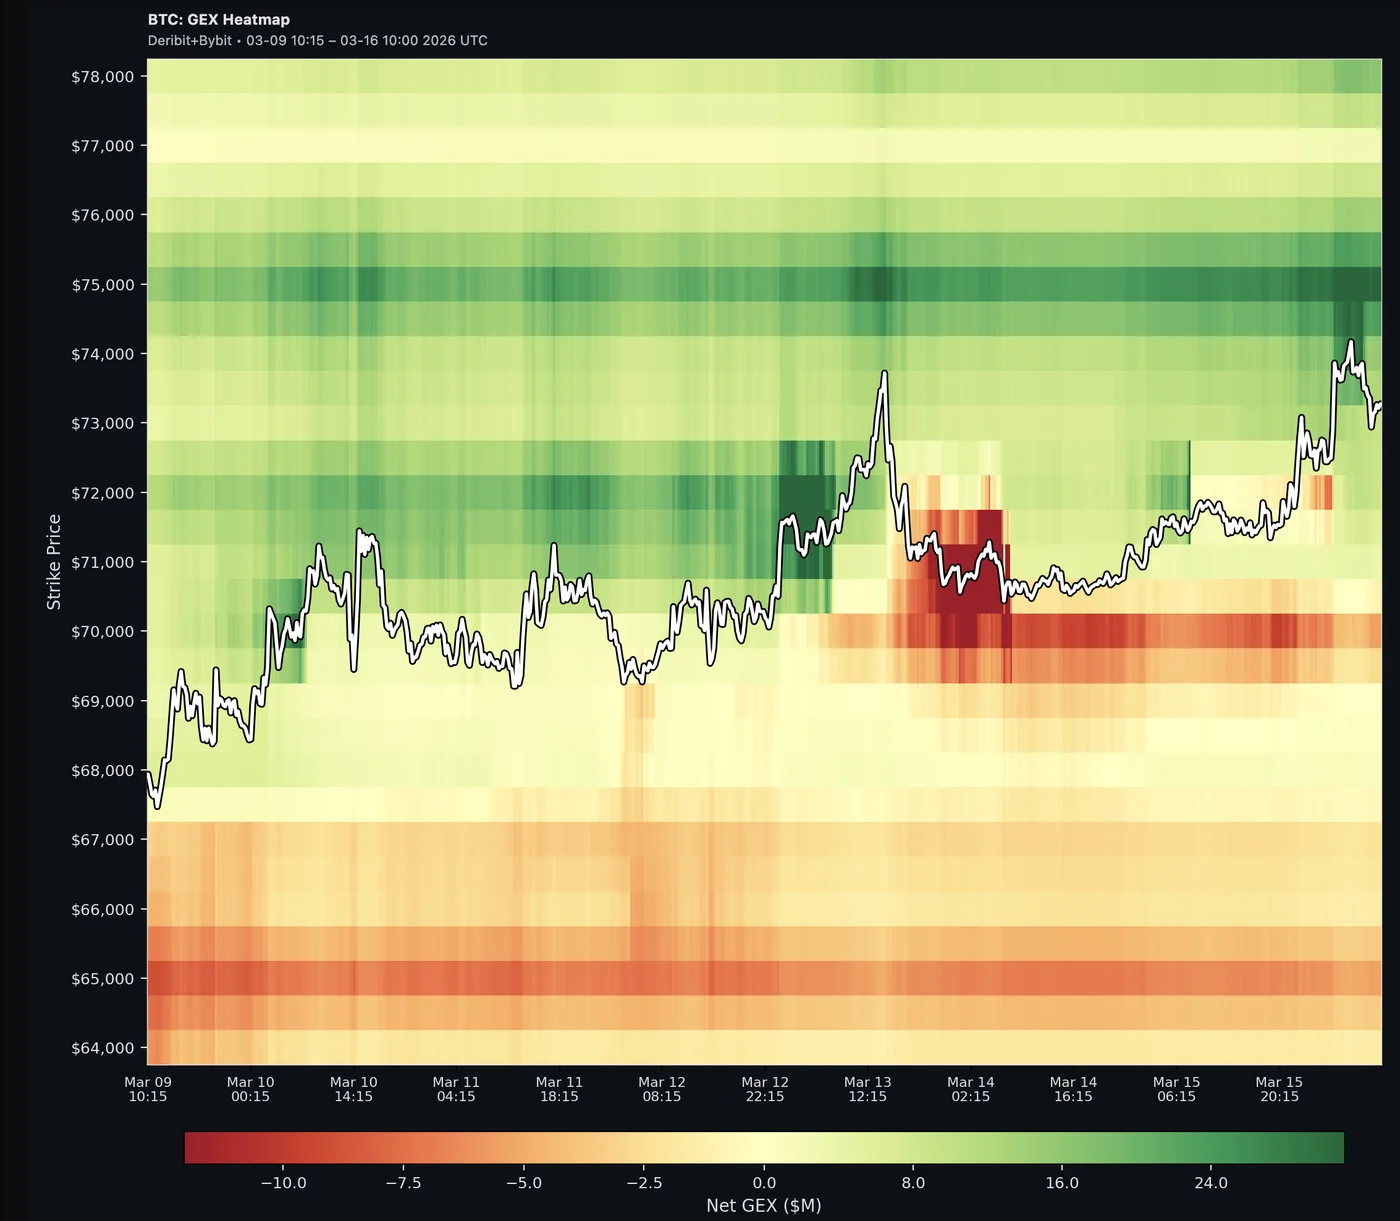 BTC Net GEX Heatmap (7 days, Deribit+Bybit): A persistent green wall sits above $74K–$75K — strong positive GEX that capped upside for most of the week. Below, a red band around $64K–$65K marks a negative GEX zone. Notice the red pocket that appeared near $70K–$71K around Mar 13 — price bounced right off it. The white line traces BTC's rally from ~$67.5K to ~$73.5K.
Absolute GEX (|GEX|)
Absolute GEX strips out directionality and shows total hedging pressure at each strike — regardless of whether it's stabilizing or amplifying. This reveals:
- Where gamma concentrates — the strikes with the most hedging activity
- How concentration shifts over time — gamma walls building up or fading
- Natural levels — price tends to gravitate toward high-|GEX| zones because massive hedging flows create friction
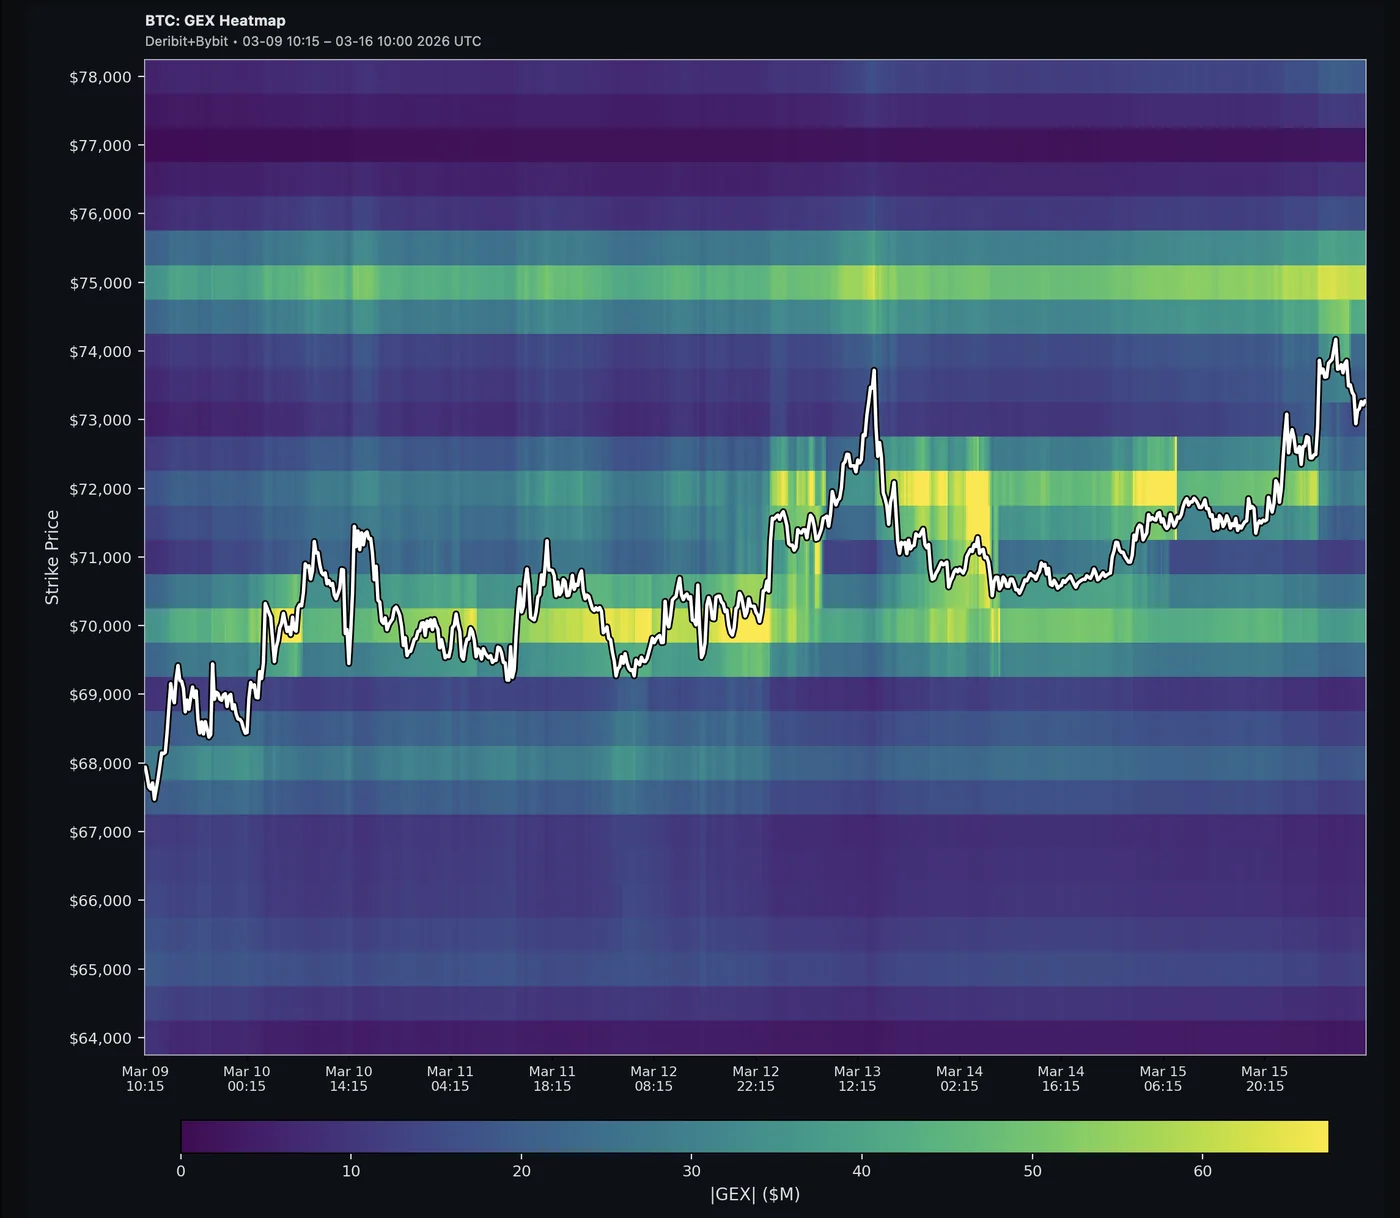 BTC |GEX| Heatmap (7 days, Deribit+Bybit): Bright yellow at $75K shows the strongest gamma concentration throughout the entire week — a massive hedging wall. The $70K zone lights up early in the period where price was trading. Below $67K, deep purple marks a gamma void — minimal hedging activity. By Mar 15, new bright spots emerge around $72K–$73K as positions are opened ahead of price moving higher.
Reading the Heatmap: What to Look For
1. Gamma Walls
Persistent bright bands (green in Net, bright in |GEX|) that hold across multiple timestamps. These are strikes where dealers have significant hedging obligations. Price approaching a gamma wall tends to slow down or bounce.
2. Gamma Voids
Dark gaps between bright bands. These are "low friction" zones where dealer hedging activity is minimal. Price can move through these areas quickly and with less resistance.
3. Migration Patterns
Watch how the bright zones shift over time. When gamma concentration migrates upward, it often signals dealers are repositioning for higher prices. When it fades, expiration or position unwinds may be reducing hedging pressure.
4. Price Path vs. Gamma Structure
The white price line overlaid on the heatmap tells the full story: Did price respect the gamma structure? In the Net GEX screenshot, notice how BTC spent Mar 9–12 oscillating in the $69K–$70K zone surrounded by mixed green and yellow. On Mar 13, a red pocket appeared near $70K–$71K and price immediately bounced upward through a neutral zone — exactly what hedging mechanics predict. The persistent green wall at $75K kept acting as a ceiling, while the void below $67K shows where price would have had no friction if it dropped.
Why This Matters: Context That Snapshots Can't Give
A single GEX by Strike bar chart shows you where gamma is right now. But markets are dynamic — positions are opened, rolled, and closed constantly. Yesterday's gamma wall might be today's void.
The heatmap answers temporal questions that snapshots can't:
- Is this gamma wall building or fading? A wall that's been bright for 12 hours is more meaningful than one that appeared 30 minutes ago
- Where was gamma when price made that move? Overlay the price path to see if a spike aligned with a gamma void
- How fast is dealer positioning changing? Rapid shifts in gamma concentration can signal upcoming volatility
Who Is This For?
The GEX Heatmap is valuable for any trader who uses structural levels:
- Futures and perps traders looking for support/resistance beyond technical analysis
- Options traders who want to see how the overall gamma landscape evolves around their positions
- Swing traders timing entries and exits around gamma walls and voids
- Analysts and researchers studying market microstructure and dealer behavior
You don't need to trade options to benefit from the heatmap. If you trade BTC, ETH, SOL, or XRP in any form, understanding where dealers must hedge gives you an edge that chart patterns alone cannot provide.
The $799/Month Alternative
Until now, temporal gamma exposure analysis was locked behind institutional pricing. Glassnode, one of the few platforms offering a crypto GEX heatmap, requires their Professional plan at $799/month (billed annually) — a plan that bundles 3,500+ on-chain metrics you may not need just to access the heatmap.
MenthorQ offers gamma models at $129/month. Amberdata targets institutions at undisclosed (likely higher) pricing.
GammaFlip brings the same analytical power — Net GEX and Absolute GEX heatmaps, multiple time ranges, multi-exchange data (Deribit + Bybit combined), interactive hover tooltips, and theme-aware rendering — at a fraction of the cost. Every new user gets full access during the 14-day free trial. After that, Premium is just €15/month — compared to $799/month elsewhere.
Institutional-grade gamma visualization shouldn't require an institutional budget.
Available Now
The GEX Heatmap is live in GEX Studio. Choose your metric (Net or |GEX|), pick a time range, and let the data speak.
The GEX Heatmap is available to Trial and Premium users. Analyze up to 90 days of history across BTC, ETH, SOL, and XRP on Bybit, Deribit, or both exchanges combined.
Key Takeaways:
- The GEX Heatmap shows gamma exposure across strikes over time — not just a single snapshot
- Net GEX reveals stabilizing (green) vs. amplifying (red) zones with directionality
- |GEX| shows total hedging pressure concentration regardless of direction
- Look for gamma walls (persistent bright bands), voids (dark gaps), and migration patterns
- Price tends to respect the gamma structure — bouncing off walls and accelerating through voids
- Previously available only on platforms charging $799/month — now accessible to every trader
GammaFlip provides analytical tools for educational purposes. This content does not constitute financial advice. Always conduct your own research and manage risk appropriately.
Ready to see GEX in action?
Try GammaFlip.io and experience professional-grade gamma exposure analysis
Open Dashboard