The Two Flip Points
A Deep Dive into Gamma Profile vs. GEX by Strike
Important
Article Outdated (Updated: January 27, 2026)
This article describes historical behavior where Flip Points differed between the GEX by Strike and Gamma Profile views. As of January 27, 2026, this is no longer the case.
What Changed: - Both GEX by Strike and Gamma Profile now use the same forecast-based calculation for Flip Points - Flip Points now match across both views, providing consistent analysis
Why the Change: The original GEX by Strike method used signal processing on static gamma data from the exchange—calculated only for the current price. This had two key limitations: 1. No scenario modeling: Could not predict hedging flow for future price levels 2. Limited accuracy: Detected zero-crossing between discrete strikes, not the exact flip point
The Gamma Profile method is fundamentally superior because it uses dynamic gamma recalculation: - Gamma is recalculated for each hypothetical future price (assuming unchanged open interest) - Provides continuous price interpolation for precise regime boundary detection - Enables "what-if" analysis: estimate hedging flow at any future price level
By using the same forecast-based calculation for both views, you now get consistent, more accurate flip points across the entire application.
Learn More: - See the January 27, 2026 CHANGELOG for details
This article is preserved for historical context and to explain the technical differences between snapshot and forecast methodologies.
Introduction: Why Do Bitcoin and Ethereum Levels Seem Inconsistent?
If you use Gamma Exposure (GEX) analysis to navigate the crypto options markets, you rely heavily on critical structural levels like the Gamma Flip Point (Zero Gamma). This level marks the transition zone where market dynamics shift from stabilizing (Positive GEX) to destabilizing (Negative GEX).
However, some advanced users notice a confusing discrepancy: the Flip Point strike shown in the main "GEX by Strike" view sometimes differs significantly from the Flip Point shown on the "Gamma Profile" curve for the exact same expiration date and time.
For example, a user recently observed a 143-point difference in the Flip Point for an ETH expiration: one view showed 2980.91 while the other showed 3124.26.
This difference is not an error; it is an expected and critical distinction that reveals the foundational power of Gamma Profile analysis: the difference between a static market snapshot and a dynamic future forecast.
Understanding this distinction is key to mastering volatility forecasting and trade execution.
📺 Watch the Video: For a detailed explanation of this concept, check out our YouTube video that walks through the two Flip points and how to use them in your trading.
Section 1: The Two Lenses of Gamma Analysis
The GammaFlip application provides two complementary analytical tools that answer different questions about the options market structure:
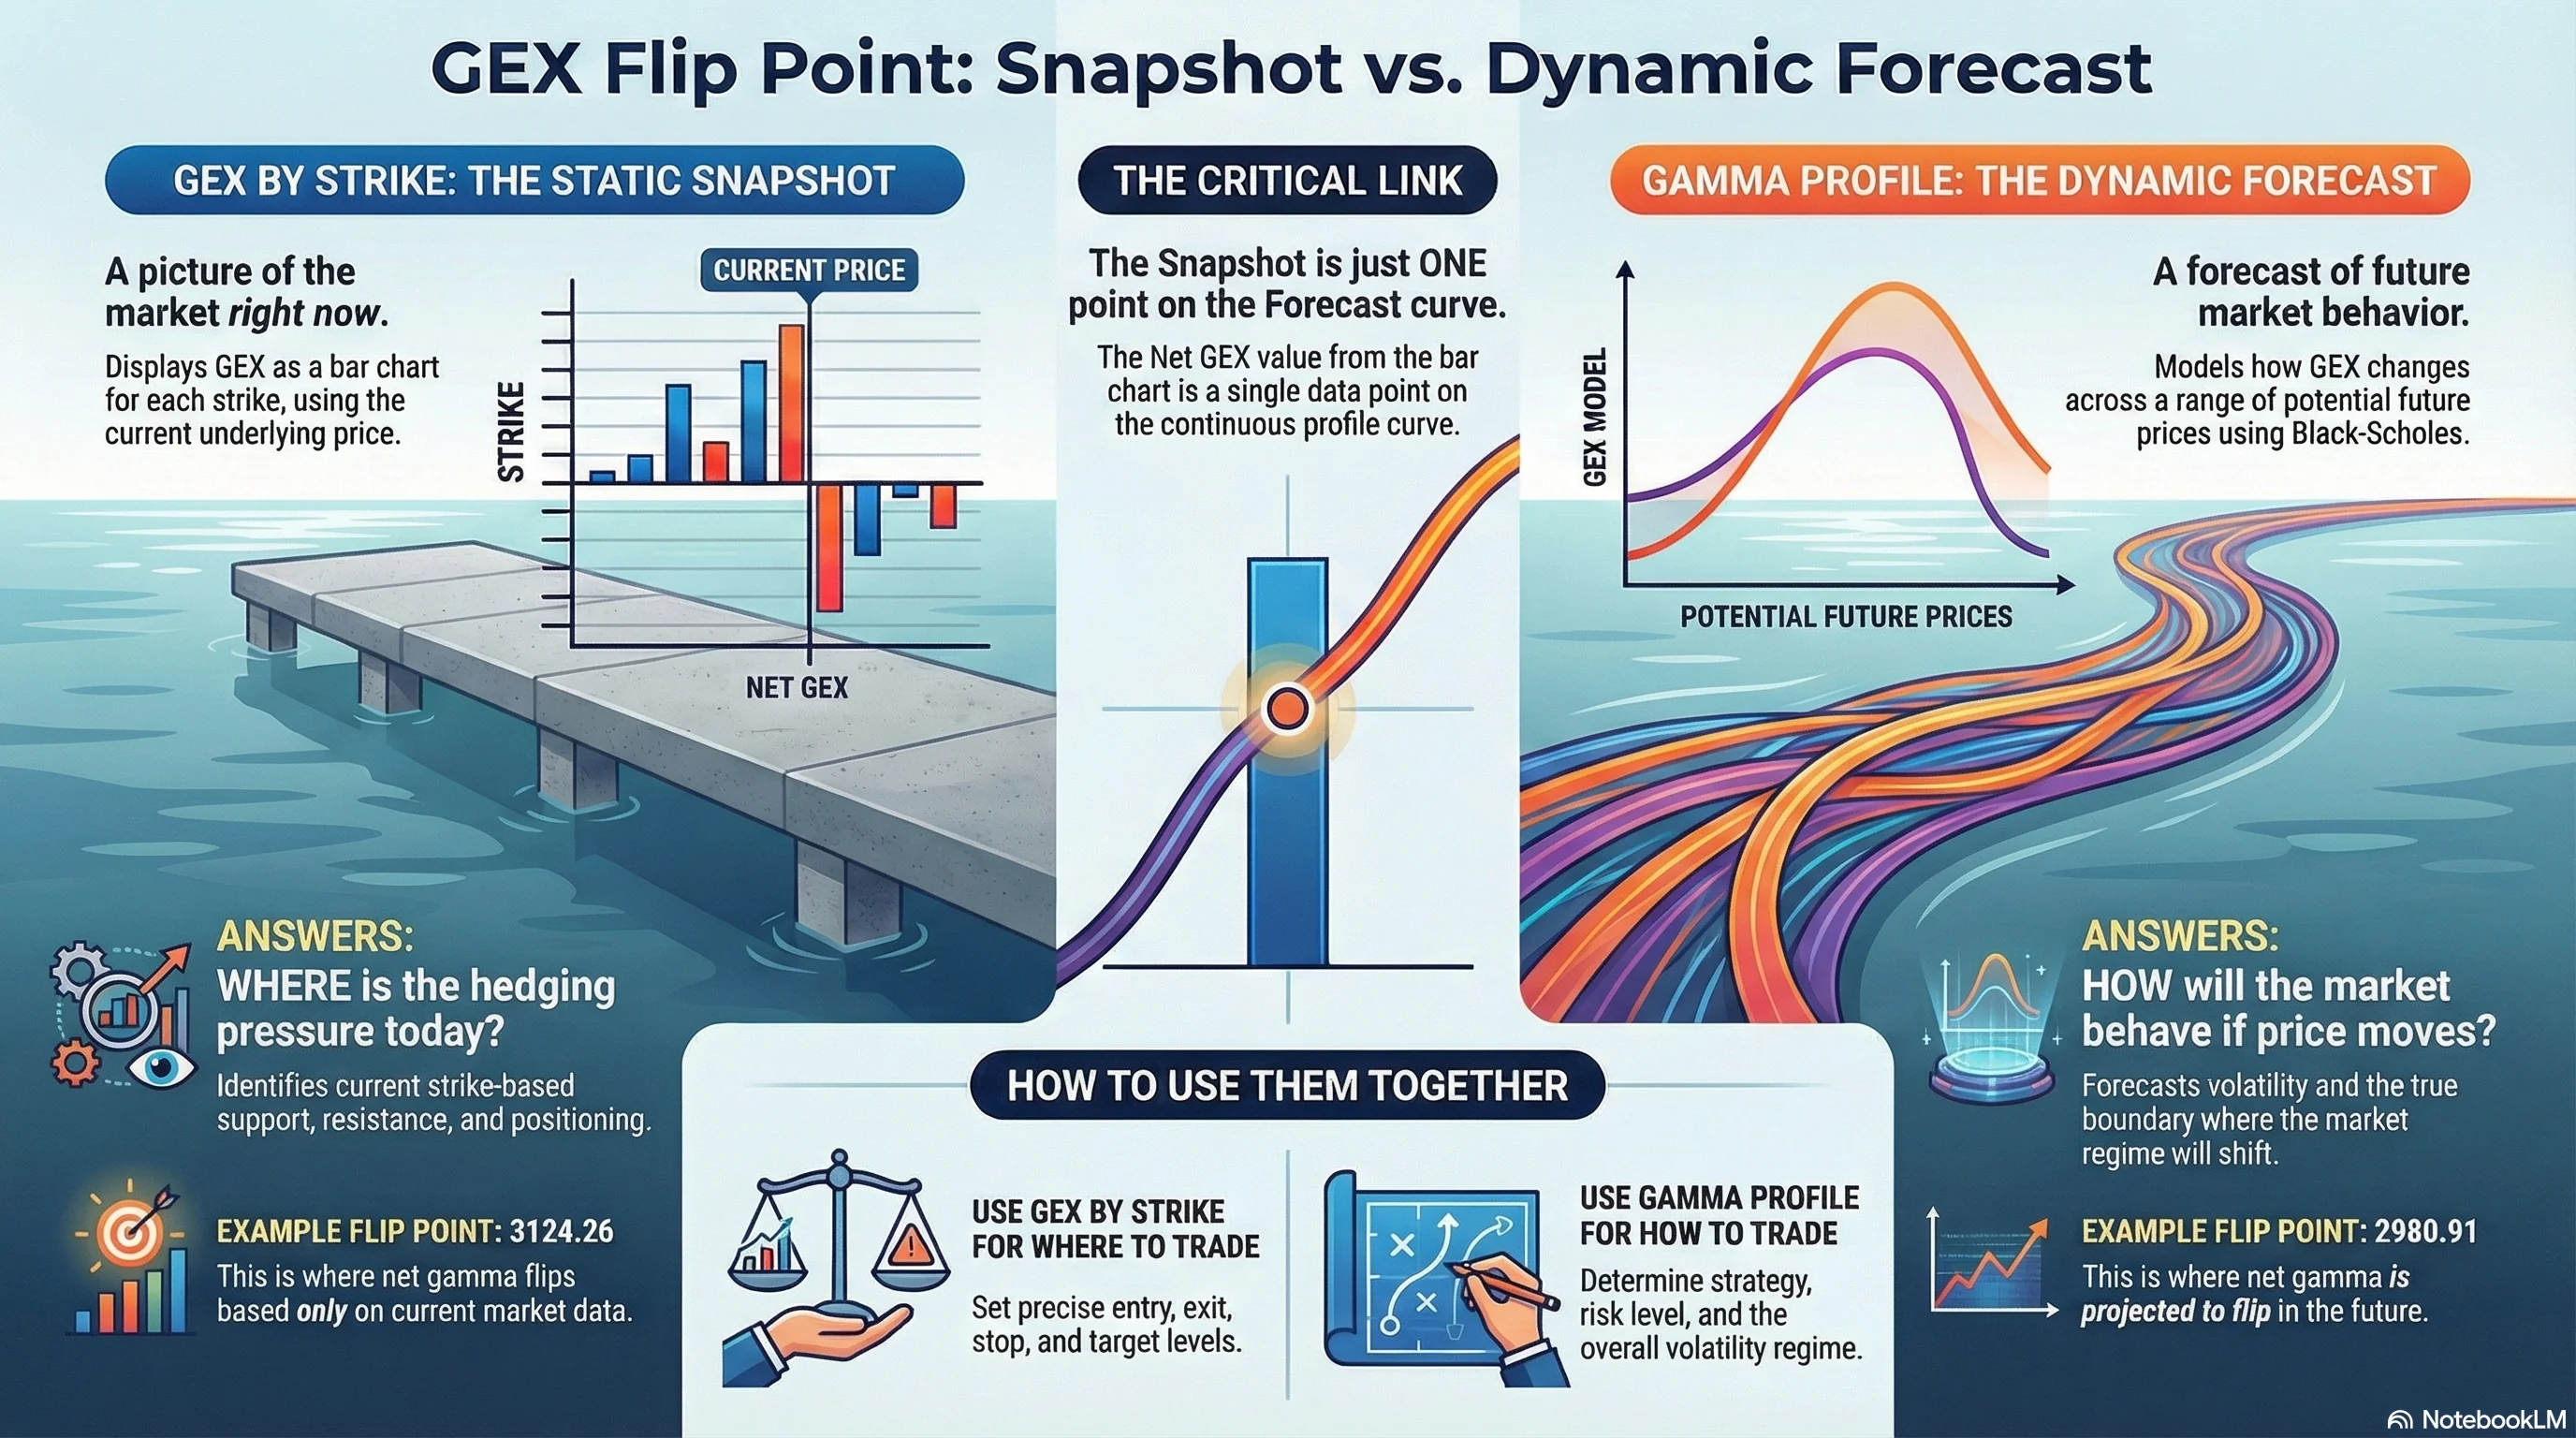
1. GEX by Strike: The Static Snapshot
The GEX by Strike chart provides a snapshot in time of the current options market structure.
- Purpose: To identify specific strike-based support, resistance, and critical price levels.
- Methodology: The calculation uses the current underlying price and the gamma data provided directly by the exchange (e.g., Bybit or Deribit).
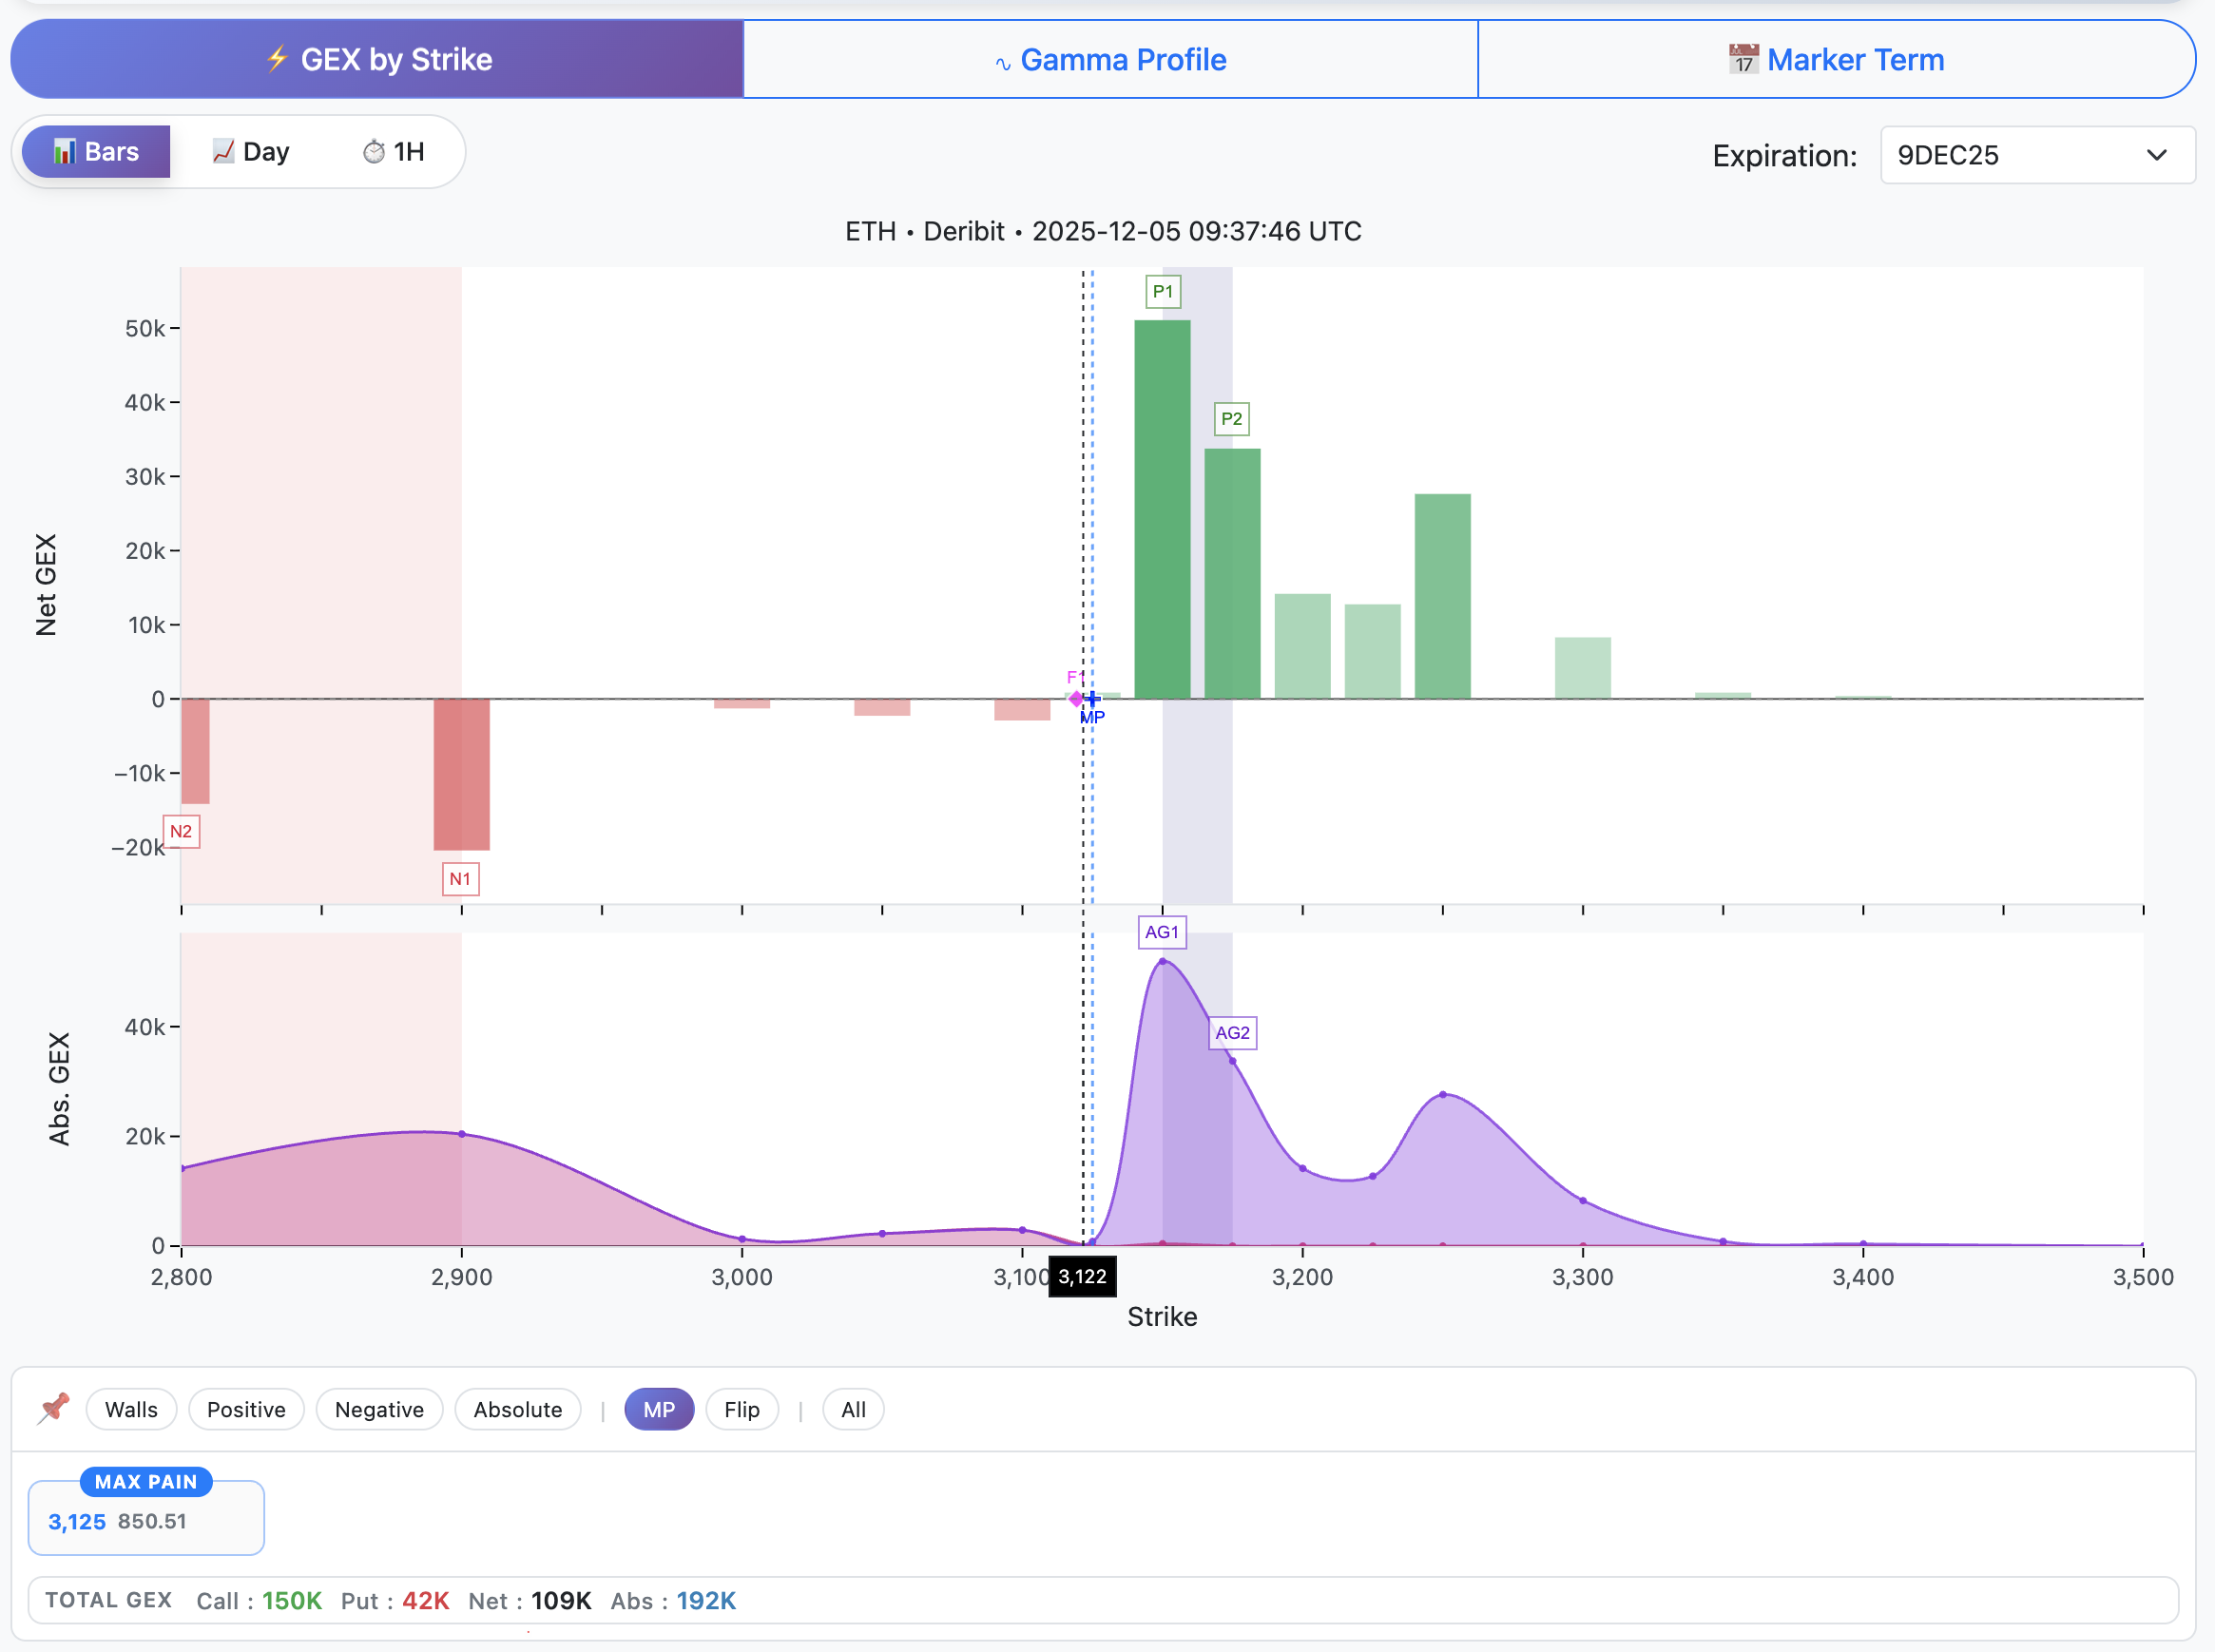
- What it Shows: A bar chart displaying Net GEX at each individual strike. Green bars represent Positive Net GEX (stabilizing zones), and red bars show Negative Net GEX (volatility zones).
- The Flip Point in this View (Marker Term): When you view the Flip Point marker in the GEX by Strike context (often through the "Marker Term" view), the value (e.g., 3124.26) is derived from applying signal processing techniques to detect where the Net GEX transitions sign within this current, static market environment. This level tells you where the bulk of current positioning is sitting.
2. Gamma Profile: The Dynamic Forecast
The Gamma Profile feature provides an advanced analysis of options gamma exposure across different price levels. This view is often called the "future outlook".
- Purpose: To reveal the volatility regime and understand how price will behave as it moves through different zones. It forecasts volatility and market direction.
- Methodology: Since option Greeks are not static, they change as the spot price moves. The Gamma Profile mathematically recalculates what the Greeks (and resulting GEX) would be for a wide range of future prices using the Black-Scholes formula (or Black-76 for crypto).
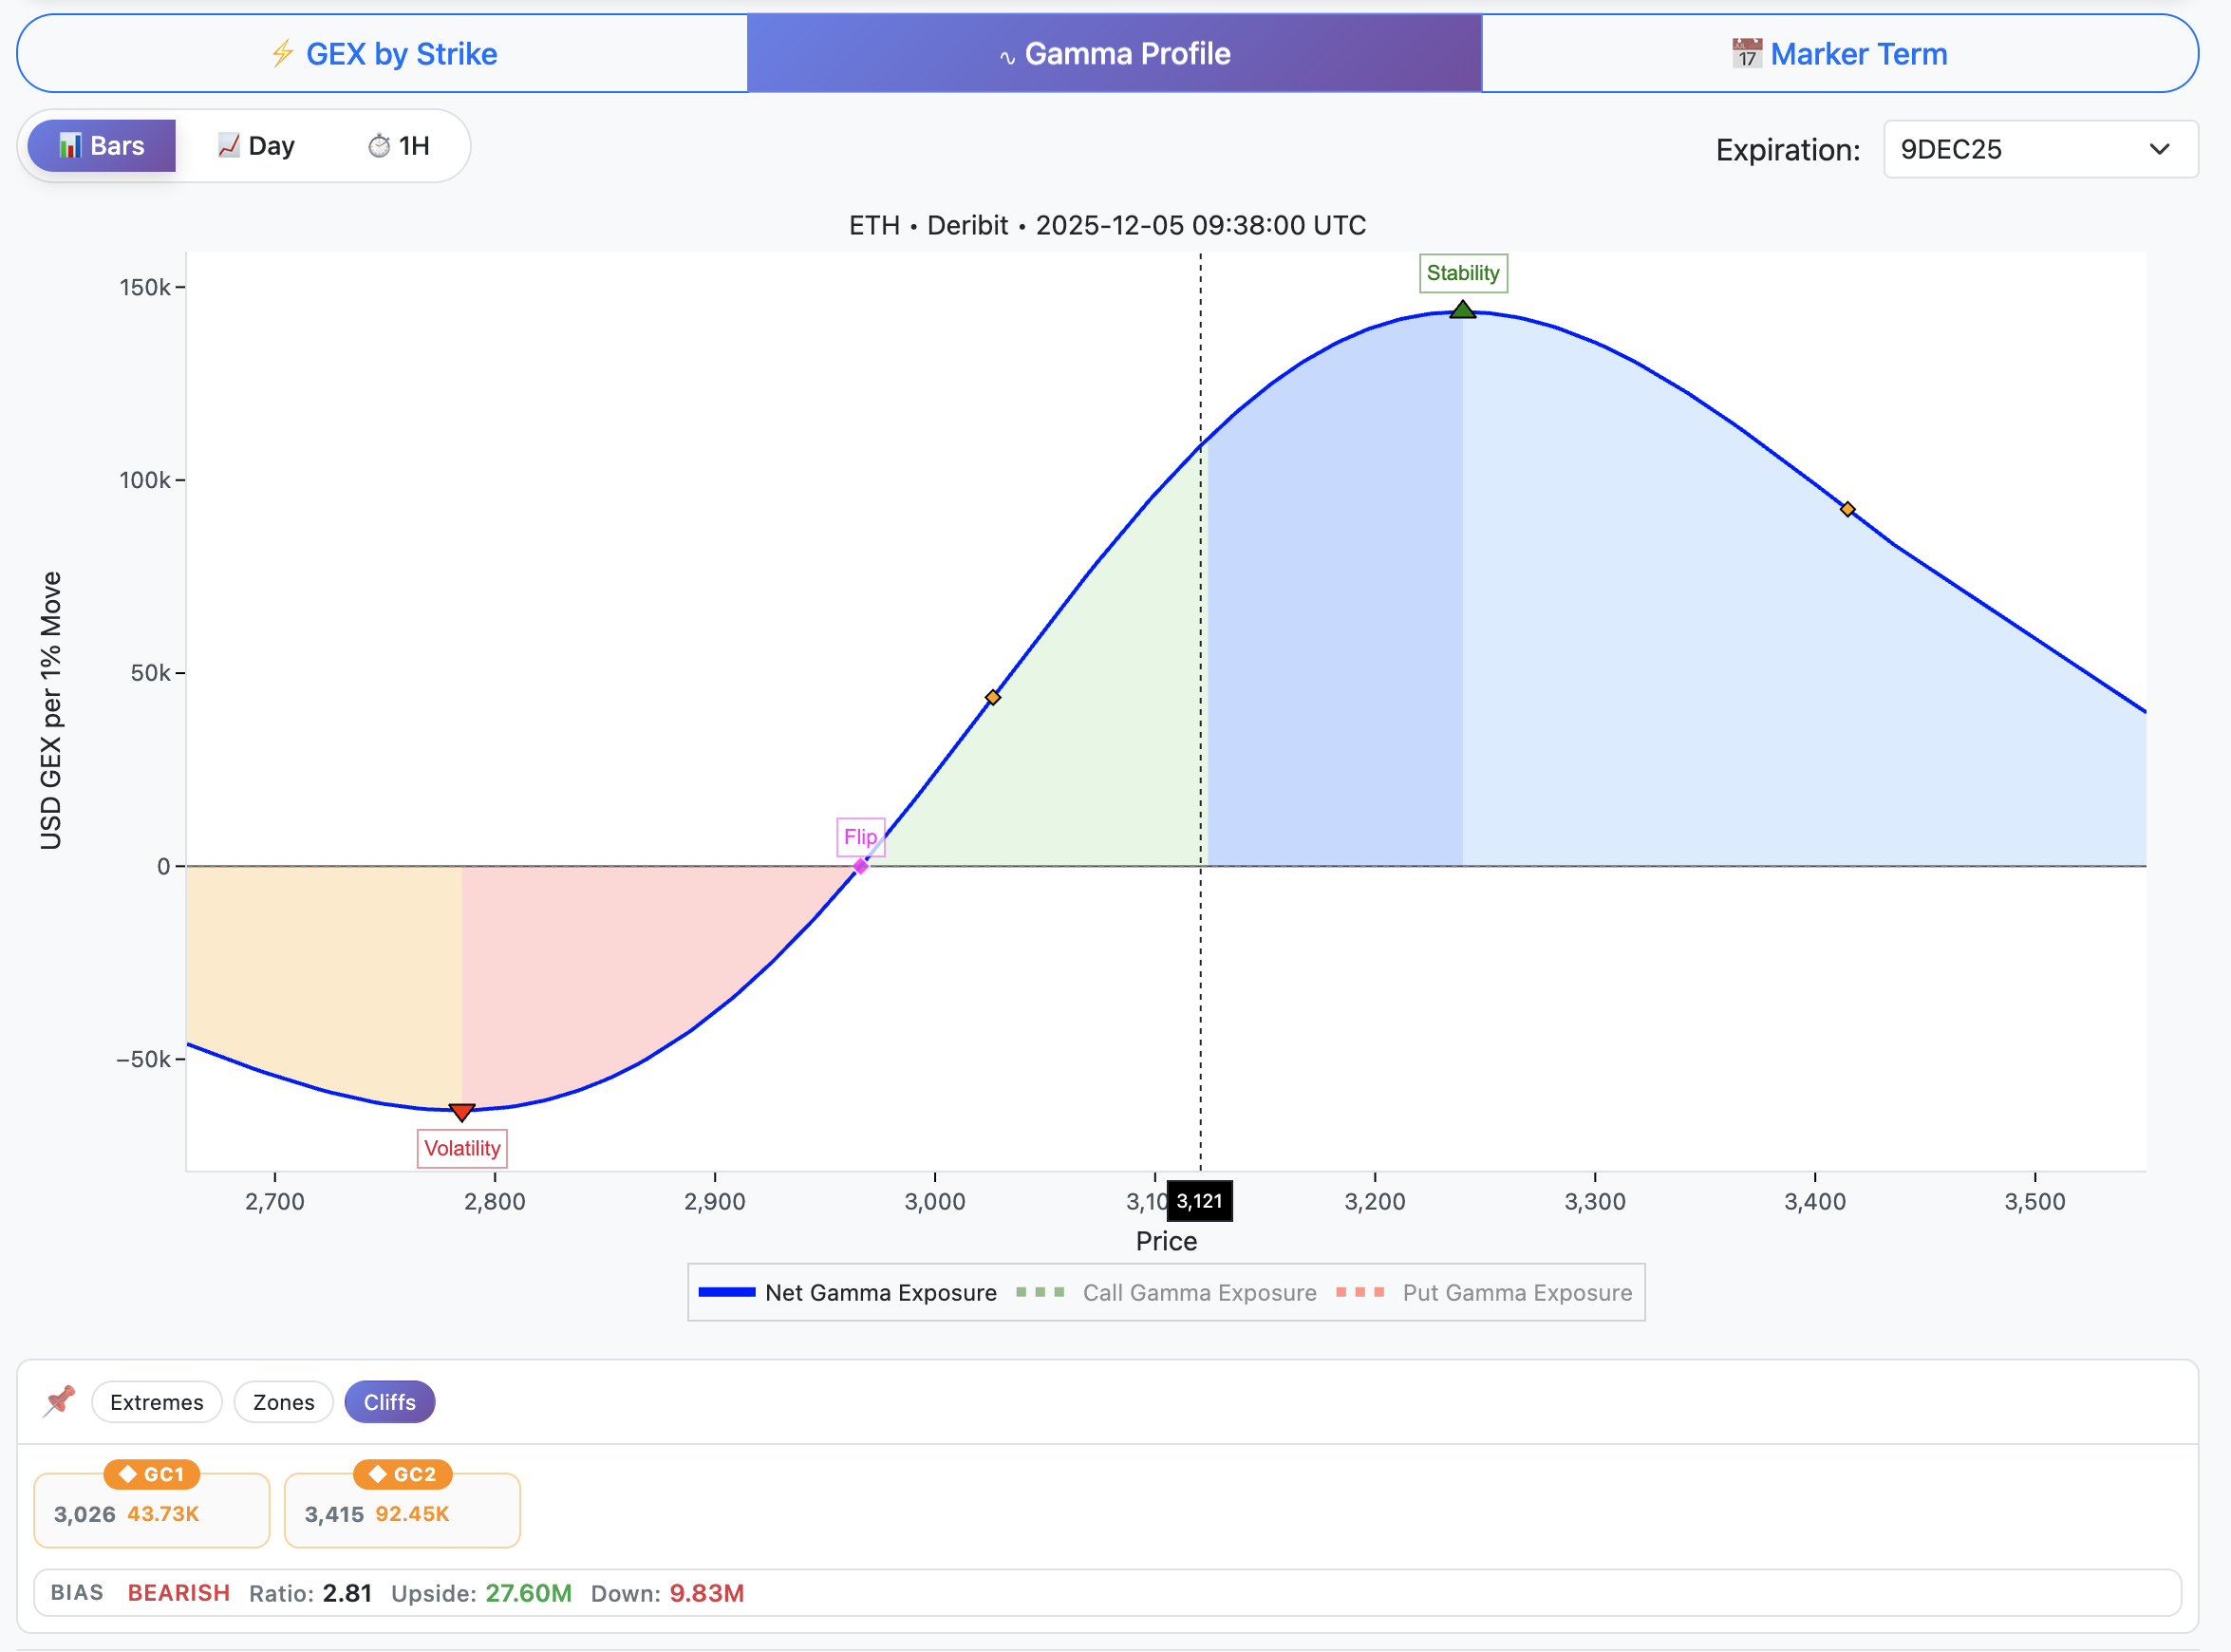
- What it Shows: A line chart displaying total gamma exposure across a continuous price range. It segments zones based on expected volatility and hedging behavior.
- The Flip Point in this View: The resulting Flip Point (e.g., 2980.91) is the projected level where Net Gamma will actually flip in the future, because it accounts for the dynamic changes in option pricing as the market approaches that level.
Section 2: Visualizing the Static vs. Dynamic Relationship
The entire difference between the two views stems from the fact that the GEX by Strike view is just one single data point on the continuous Gamma Profile curve.

Consider the following example for ETH with the 9DEC25 expiration:
| Feature | GEX by Strike (Left Chart) | Gamma Profile (Right Chart) |
|---|---|---|
| Data Type | Snapshot of current market | Dynamic forecast across price range |
| Net GEX | 109K (Calculated at current price) | 109K (A single point on the curve) |
| Interpretation | This positive Net GEX value implies that if the price were to increase by 1% from the current level, market makers would need to sell approximately $109K of the underlying asset to hedge their positions. | The curve answers "what if" questions, such as: What would the GEX profile look like if the price moved to 2950?. |
The red arrow in the visualization demonstrates that the 109K Net GEX value taken from the GEX by Strike chart is simply a single point on the broader Gamma Profile curve at the current price.
The Gamma Profile shows how net GEX changes if the spot price moves to different levels. By following the curve, you can see that at approximately ~2950 (or the 2980.91 mark in the user's example), Net GEX hits zero. This is the dynamically calculated Flip Point, indicating that at this specific price level, no net hedging activity would be expected from market makers because the stabilizing positive gamma is exactly balanced by the destabilizing negative gamma.
Section 3: Trading Application: Which Marker Should You Trust?
For making reliable trading decisions, you must use both views correctly.
For Current Hedging Pressure and Key Levels: Use GEX by Strike
Use the GEX by Strike chart and its markers (P1, N1, Max Pain) to estimate:
- Current Hedging Pressure: See where the bulk of existing positions are located.
- Precise Levels: Identify specific strike-based support and resistance levels (Call Walls and Put Walls).
- Entry/Exit Targets: Use P1/P2 (resistance/support) and Max Pain as high-probability reversal zones and targets.
For Volatility Regime Change: Use Gamma Profile
The Gamma Profile provides a more reliable prediction for where the market structure will truly shift.
- The Flip Point: Use the Gamma Profile Flip Point for the most accurate estimation of the Volatility Regime Boundary.
- Price moving Above the Flip Point suggests entering positive territory where dealers are net long gamma and market stabilization is expected (low volatility).
- Price moving Below the Flip Point suggests entering negative territory where dealers are net short gamma, volatility is high, and price moves are amplified.
- Volatility Forecast: Use the Gamma Profile to identify Gamma Cliffs (explosive volatility risk zones) and Peak -Gamma (highest volatility risk zone).
- Strategy Selection: The Gamma Profile helps you determine the overall regime: Positive Gamma favors mean reversion/selling premium, while Negative Gamma favors directional/momentum trading and buying volatility.
The structural edge comes from combining all elements: using the Gamma Profile to decide how to trade (strategy type, position size, risk level) and using GEX by Strike to decide where to trade (entry, exit, stops, targets).
Conclusion: Mastering the Structural Edge
The 143-point difference in the Flip Point observed by our user highlights the fundamental necessity of dynamic calculation in options analysis.
- If you rely solely on the static snapshot of the current market (GEX by Strike), you risk miscalculating the true boundary where the dealer hedging regime inverts.
- The Gamma Profile, by utilizing the Black-Scholes methodology to model gamma changes across future price points, provides the essential forecast for anticipating market volatility changes and structural shifts.
GEX analysis reveals the structural forces that traditional technical analysis misses, allowing you to anticipate market moves rather than merely reacting to them. By consistently applying this methodology and integrating the insights from both GEX by Strike and the Gamma Profile, you gain a sophisticated edge unavailable to those trading purely on surface-level data.
Related Articles
Ready to see GEX in action?
Try GammaFlip.io and experience professional-grade gamma exposure analysis
Launch App