
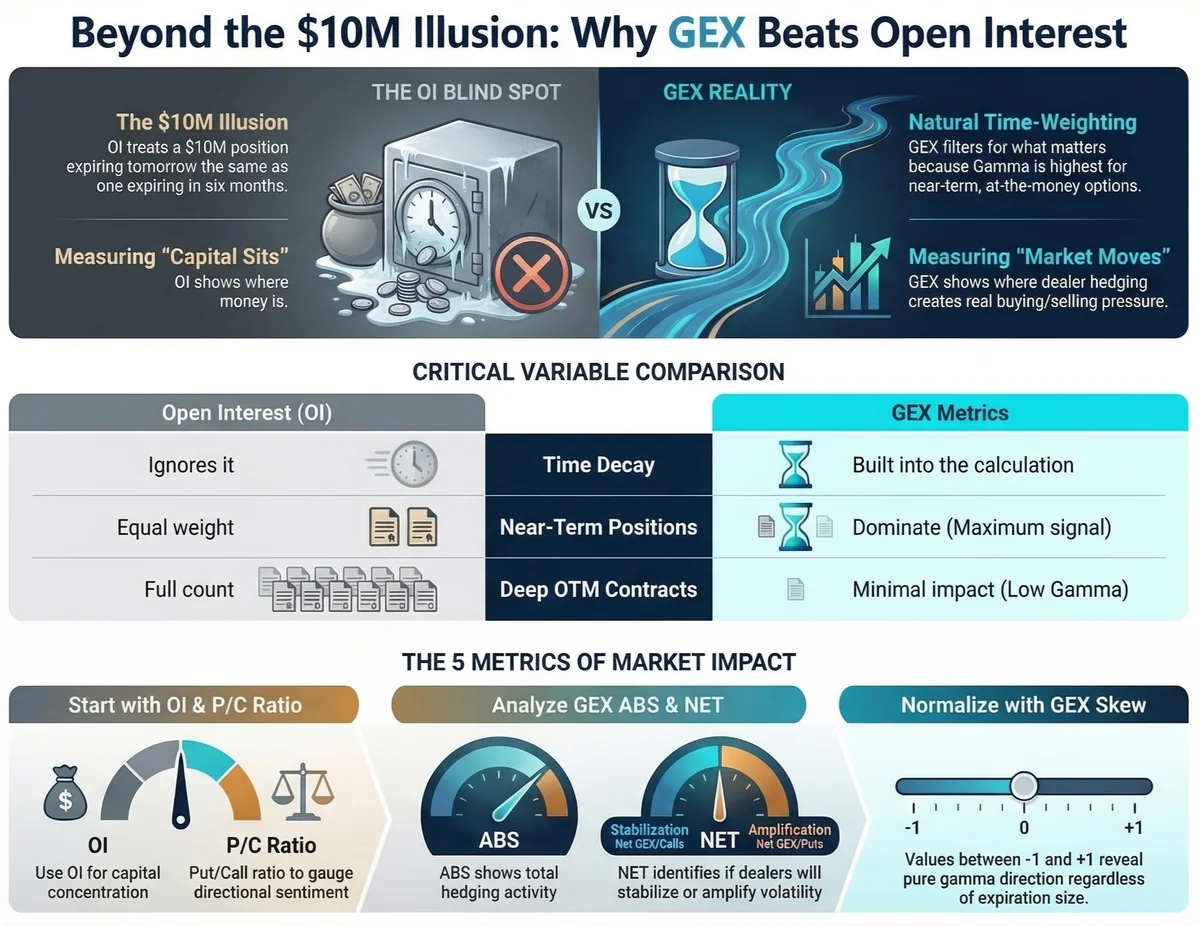
The $10M Illusion
Two Bitcoin option positions, both worth $10 million in open interest. One expires tomorrow. The other expires in six months.
To an OI chart, they look identical. To the market, they couldn't be more different.
The position expiring tomorrow carries massive gamma — every dollar Bitcoin moves forces dealers to hedge aggressively, creating real buying and selling pressure. The six-month position? Its gamma is negligible. Dealers barely need to hedge it at all.
This is the fundamental blind spot of Open Interest analysis. OI tells you where capital is parked. It says nothing about where hedging flows actually happen.
Five Metrics, One Chart
GammaFlip's Term OI view now offers five distinct ways to analyze the expiration term structure. Each reveals something the others can't.
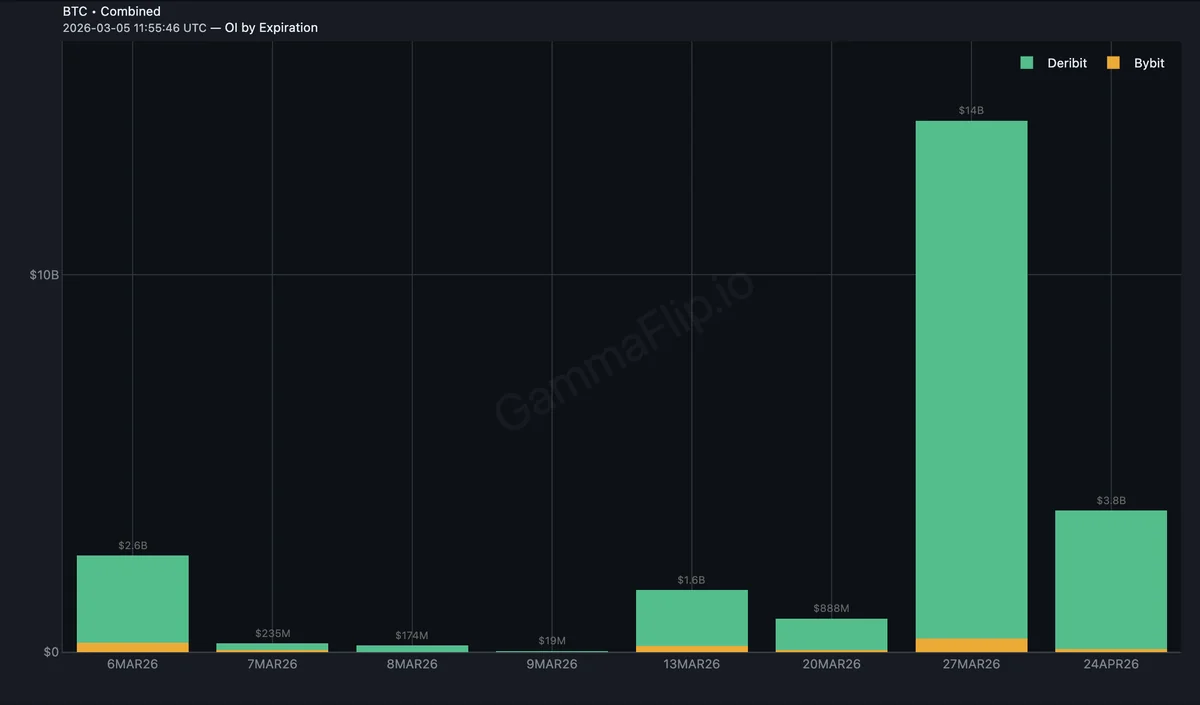
1. Open Interest (OI)
The baseline. Total notional value of outstanding contracts per expiration, stacked by exchange.
What it shows: Where capital is concentrated across the term structure.
What it misses: Time. A $50M position expiring in 3 days and a $50M position expiring in 90 days get equal bars — but their market impact differs by orders of magnitude.
Use it for: Identifying which expirations have the most "skin in the game" and comparing exchange market share per expiration.
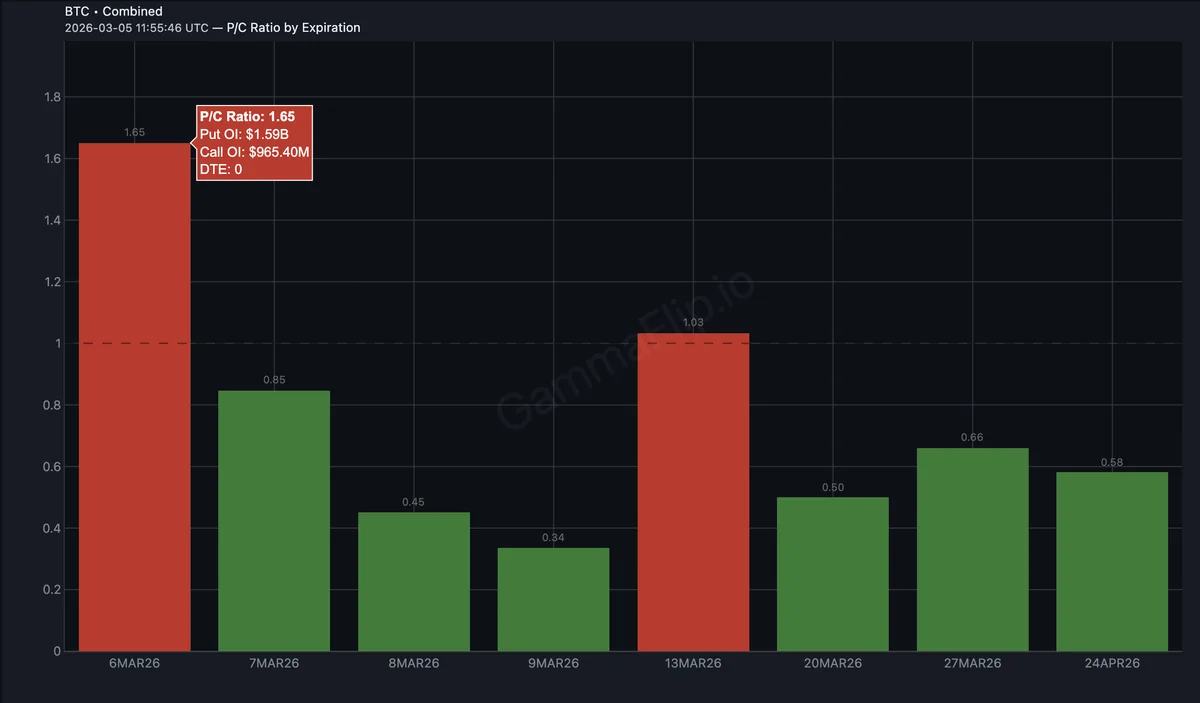
2. P/C Ratio (Put/Call)
Put OI divided by Call OI for each expiration. The industry-standard sentiment gauge.
- < 1.0 (green bars) — Call-heavy, bullish positioning
- = 1.0 (dashed line) — Balanced
- > 1.0 (red bars) — Put-heavy, bearish sentiment or protective hedging
P/C Ratio normalizes naturally — a small expiration and a large one are directly comparable. The reference line at 1.0 is universally meaningful.
Watch for: Expirations where P/C Ratio diverges sharply from neighbors. A sudden spike to 1.5+ on a near-term expiration often signals protective put buying ahead of a catalyst.
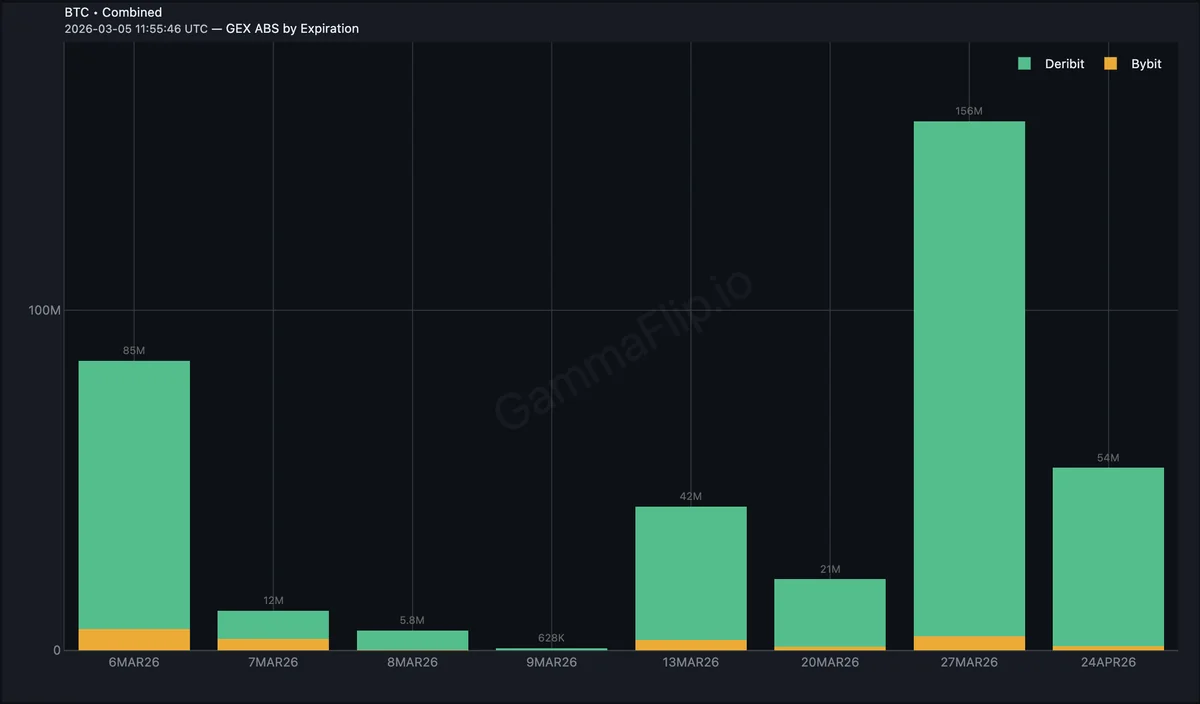
3. GEX ABS (Absolute Gamma Exposure)
This is where OI's blind spot gets corrected.
Absolute GEX = |Call GEX| + |Put GEX| per expiration. It measures total hedging activity regardless of direction.
The key difference from OI: Gamma is highest for near-term, at-the-money options. It decays rapidly for far-dated or deep out-of-the-money positions. This means GEX naturally time-weights the data.
That $10M position expiring tomorrow? It dominates the GEX chart. The six-month position barely registers. This is exactly right — the near-term position is what's actually driving market maker hedging flows.
Use it for: Finding where the real hedging pressure lives, not just where capital is parked.
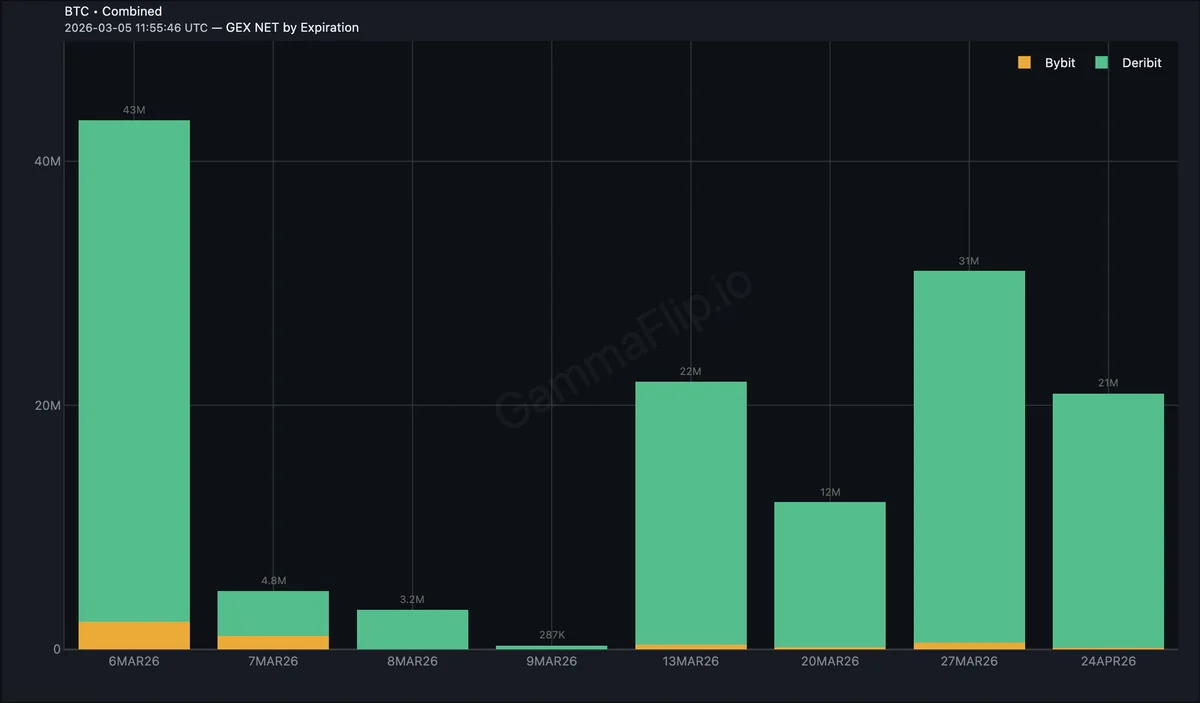
4. GEX NET
Net GEX = Call GEX + Put GEX (where put gamma contributes negatively) per expiration.
- Positive bars — Dealer hedging stabilizes price (buy dips, sell rallies)
- Negative bars — Dealer hedging amplifies moves (sell into weakness, buy into strength)
The chart uses relative stacking so you can see positive and negative contributions from each exchange separately.
The trading insight: When near-term expirations show deeply negative Net GEX, dealers are set up to amplify moves. This is the "volatility regime" — trends accelerate, reversals are violent. When Net GEX is positive, expect mean-reversion and range-bound action.
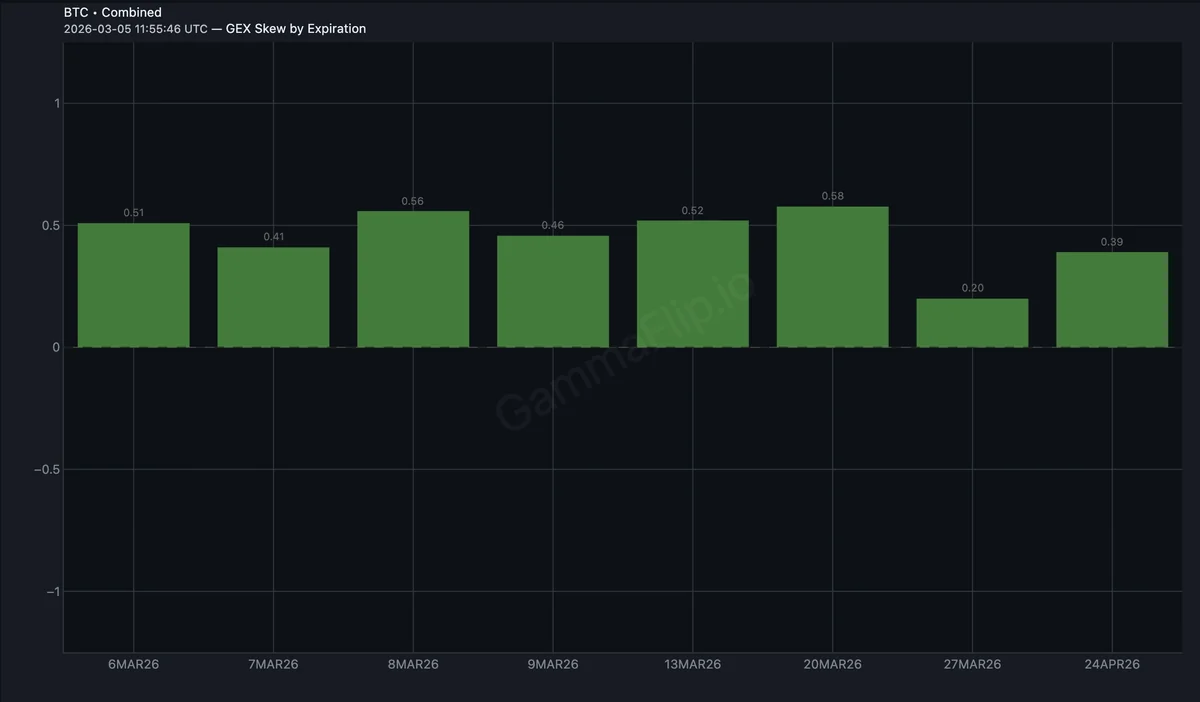
5. GEX Skew
The most nuanced metric. GEX Skew = Net GEX / Absolute GEX, producing a value between -1 and +1.
- +1 — Entirely call-dominated gamma (maximum stabilization)
- 0 — Balanced
- -1 — Entirely put-dominated gamma (maximum amplification risk)
Why normalize? Raw Net GEX values are hard to compare across expirations. A large expiration might show $50M net GEX while a small one shows $500K — but both could have the same directional character. GEX Skew strips out size and reveals pure gamma direction.
Think of it as the P/C Ratio equivalent for gamma. P/C Ratio normalizes OI sentiment. GEX Skew normalizes gamma direction.
Use it for: Quickly scanning which expirations are call-dominated vs put-dominated, independent of their size.
OI vs GEX: The Time Factor
The core insight behind all GEX metrics is gamma's natural time-weighting.
| Aspect | Open Interest | GEX Metrics |
|---|---|---|
| Time decay | Ignores it | Built into gamma calculation |
| Far-dated positions | Equal weight | Naturally filtered out |
| Near-term positions | Equal weight | Dominate (correctly) |
| Deep OTM contracts | Full count | Low gamma, minimal impact |
| ATM near-term | Same as any other | Maximum gamma, maximum signal |
| What it measures | Capital deployed | Hedging pressure generated |
When you look at OI, you see where money is. When you look at GEX, you see where money moves the market.
Putting It Together
These five metrics form a complete analytical framework:
- Start with OI to see where capital is concentrated
- Check P/C Ratio for directional sentiment per expiration
- Switch to GEX ABS to see where hedging pressure actually lives
- Use GEX NET to identify stabilization vs amplification regimes
- Compare with GEX Skew to spot directional outliers across the term structure
The TOTAL bar (toggleable) aggregates all expirations into a single summary — useful for a quick read of the overall market structure.
Key Takeaways
- OI is necessary but not sufficient. It shows capital concentration but ignores the time factor that determines actual market impact.
- GEX metrics are time-weighted by nature. Gamma is highest for near-term ATM options, making GEX a natural filter for what actually matters.
- P/C Ratio and GEX Skew are the normalized metrics. Both are comparable across expirations regardless of size — P/C for sentiment, GEX Skew for gamma direction.
All five metrics are available in GammaFlip's Term OI view — switch between them using the metric toggle above the chart.
Note
This is not financial advice. Options analysis tools provide analytical frameworks, not trading signals. Always do your own research and manage risk appropriately.
Ready to see GEX in action?
Try GammaFlip.io and experience professional-grade gamma exposure analysis
Launch App