GEX Comes to Stocks & Indices: TradFi Options in GammaFlip
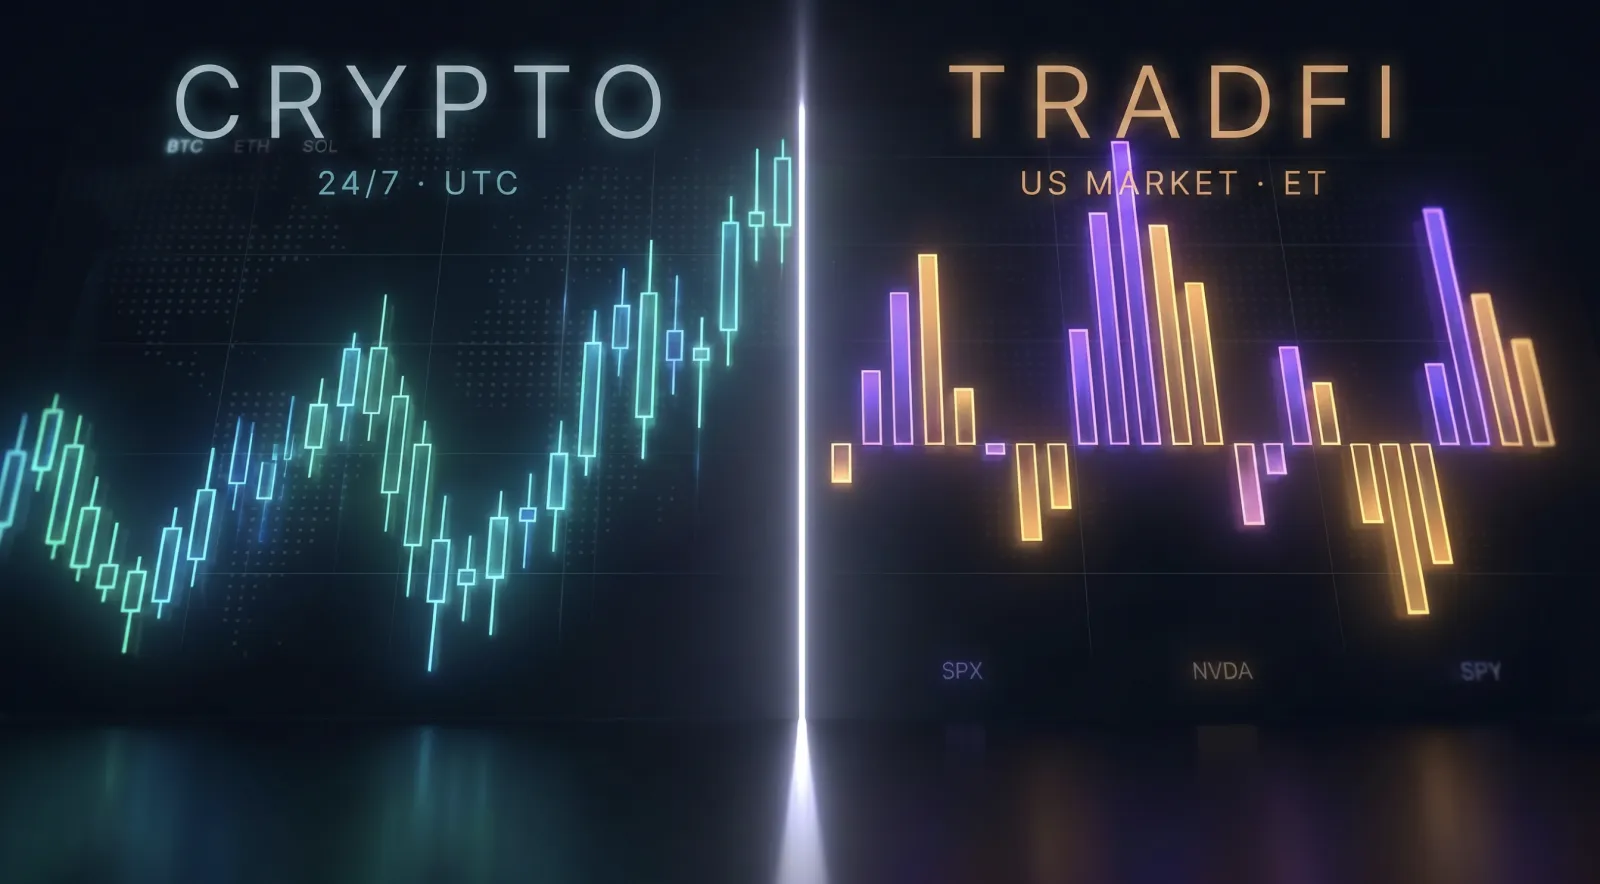
The gamma engine you've been using for Bitcoin and Ether now runs on US stocks and indices too. Same charts, same signals — a whole new asset class.
If you trade crypto with GEX, you already know the drill: find the flip point, watch the walls, read the hedging pressure. Now you can do exactly that on SPX, SPY, NVDA, and ten more of the most actively traded US-listed names — side by side with crypto, in the same app.
This is a big one for us, and it's live now. Here's what shipped, how to turn it on, and the few things that genuinely work differently in traditional markets.
What we added
Thirteen instruments in the first batch, picked for deep, liquid options markets:
| Type | Tickers |
|---|---|
| Index | SPX |
| ETFs | SPY, QQQ, IBIT, GLD, SLV |
| Stocks | NVDA, AAPL, TSLA, MSFT, AMZN, META, AMD |
A deliberate mix: the S&P complex (SPX/SPY), the Nasdaq-100 (QQQ), the mega-cap single names that drive the tape (NVDA, AAPL, TSLA, MSFT, AMZN, META, AMD), and the metals (GLD, SLV). IBIT — the spot Bitcoin ETF — is the bridge: now you can read dealer positioning in BTC and its biggest ETF wrapper without leaving the app.
How to switch
There's a single toggle. Click the context pill in the header (the one showing your coin, exchange, and expiration), and at the top of the panel you'll see a Crypto / TradFi switch.
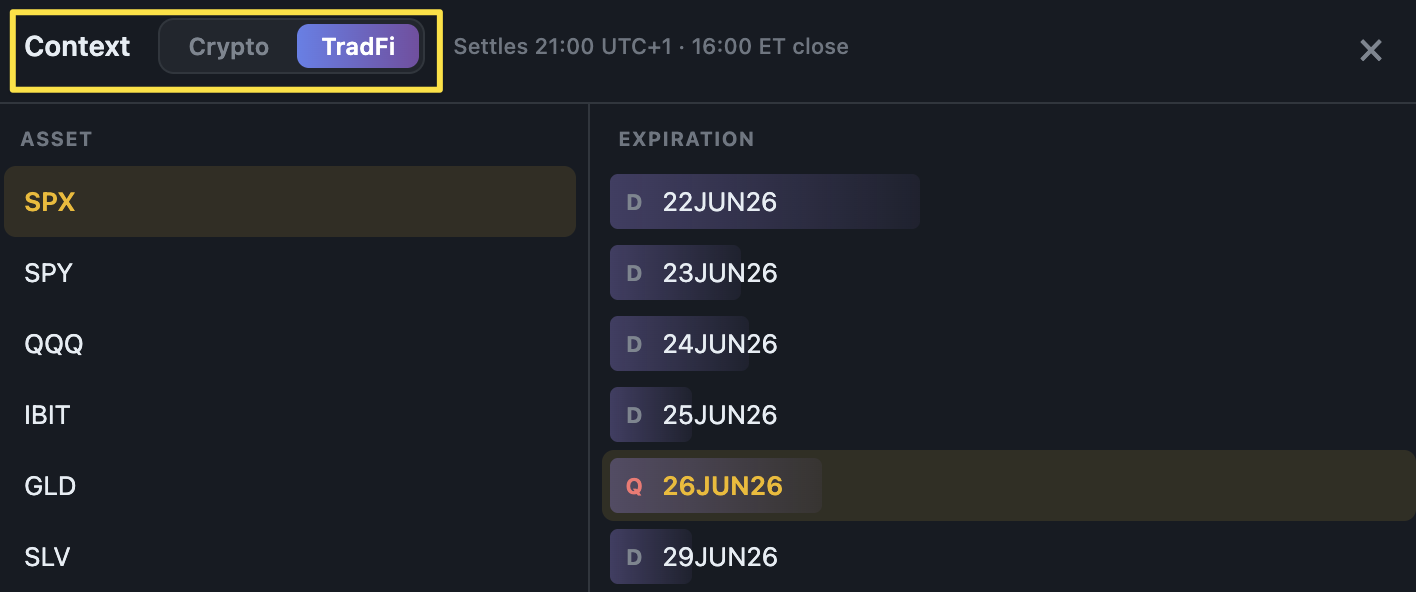 Flip to TradFi and the asset list swaps to stocks and indices. Pick SPX and you're reading gamma in two clicks.
Flip to TradFi, the coin list becomes the ticker list, and you're in. Everything below — strike chart, profile, heatmap, navigation — stays exactly where you left it.
What's different from crypto
Crypto never sleeps. Traditional markets do, and that changes a few things.
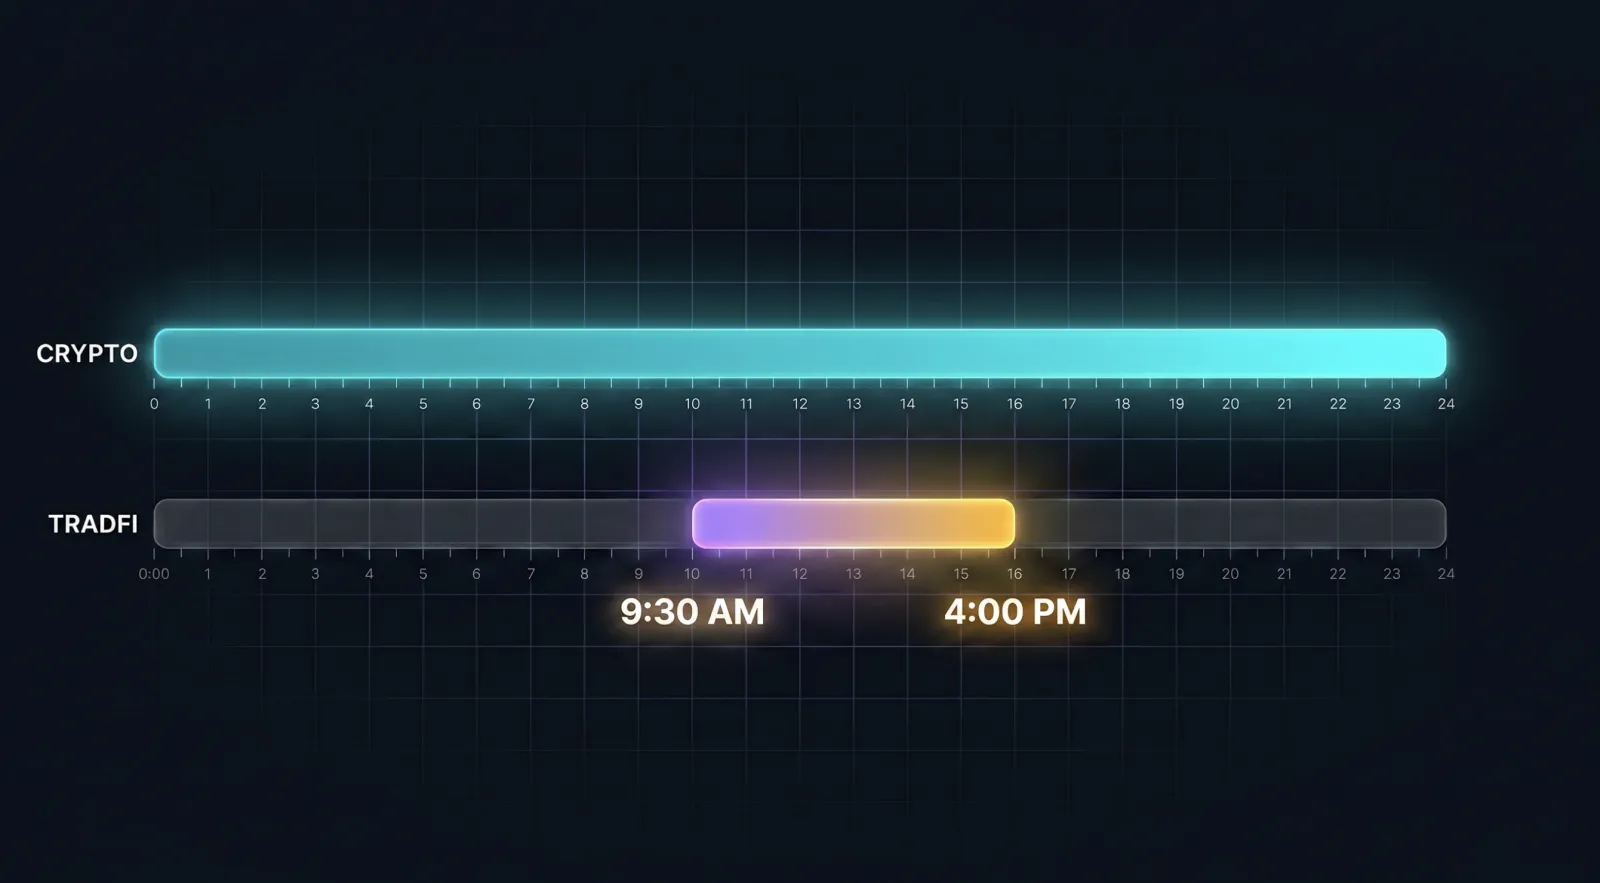 Crypto is a continuous UTC ribbon; TradFi lights up only during the US session — outside it, you're reading the last end-of-day snapshot.
Three you'll notice right away:
1. The market isn't open 24/7. US options trade roughly 09:30–16:00 ET on weekdays. We track that, expose an is_live flag in the data, and the summary rail tells you whether you're looking at a live session or a closed one. When the market is closed, we show the last complete end-of-day snapshot — not a fake "now" reading stitched together from stale ticks.
2. Time is New York, not UTC. Crypto expiries land at 08:00 UTC like clockwork. TradFi runs on US Eastern time, daylight-saving and all. Every expiration and every time-to-expiry calculation is anchored to the actual settlement instant in ET, so your DTE is correct on both sides of a DST change.
3. Expirations are messier — in a good way. Crypto gives you a clean daily/weekly UTC grid. Index and equity options don't:
- SPX carries two roots at once — classic AM-settled monthlies (settled at the Friday open) and PM-settled weeklies and dailies (the
SPXWroot), including same-day 0DTE. We pull both so your chain is complete. - ETFs and single stocks are PM-settled at 16:00 ET.
The upshot: 0DTE on SPX is a first-class citizen here, with the correct intraday cutoff rather than a UTC approximation.
One honest caveat: open interest is end-of-day
Worth saying plainly. Open interest for TradFi is an end-of-day figure. Inside a live session we refresh implied vol and recompute gamma, but the OI term in the GEX formula is yesterday's close until the next end-of-day update lands.
That means intraday TradFi GEX is an approximation — the gamma is current, the position count behind it is from the last close. On crypto we read open interest live from the exchange, so those numbers are exact in real time. For end-of-day and overnight analysis the two are equivalent; for fast intraday work on TradFi, treat the levels as a high-quality estimate, not a tick-by-tick truth. We'd rather tell you that than let you assume a precision that isn't there.
How this is different from a static GEX snapshot
Most tools that show GEX on stocks hand you one thing: a static end-of-day picture and a single net-GEX number. Useful, but flat.
Every instrument you add here gets the full GammaFlip toolkit instead:
- GEX by strike — the walls, the flip point, max pain, all marked.
- Hedging-pressure profile — where dealer flow accelerates or dampens moves.
- Term structure — OI, put/call, and GEX across every expiration.
- GEX heatmap — how gamma evolved over 24h, 3d, 7d, 30d, or 90d, with the price path drawn on top.
- Monte Carlo — 20,000 simulated paths under light, normal, and strong gamma influence.
And because crypto and TradFi live in the same app, you can compare dealer positioning across markets — BTC against IBIT, or risk-on names against the index — without switching tabs or tools. That cross-market read is the part you can't easily get anywhere else.
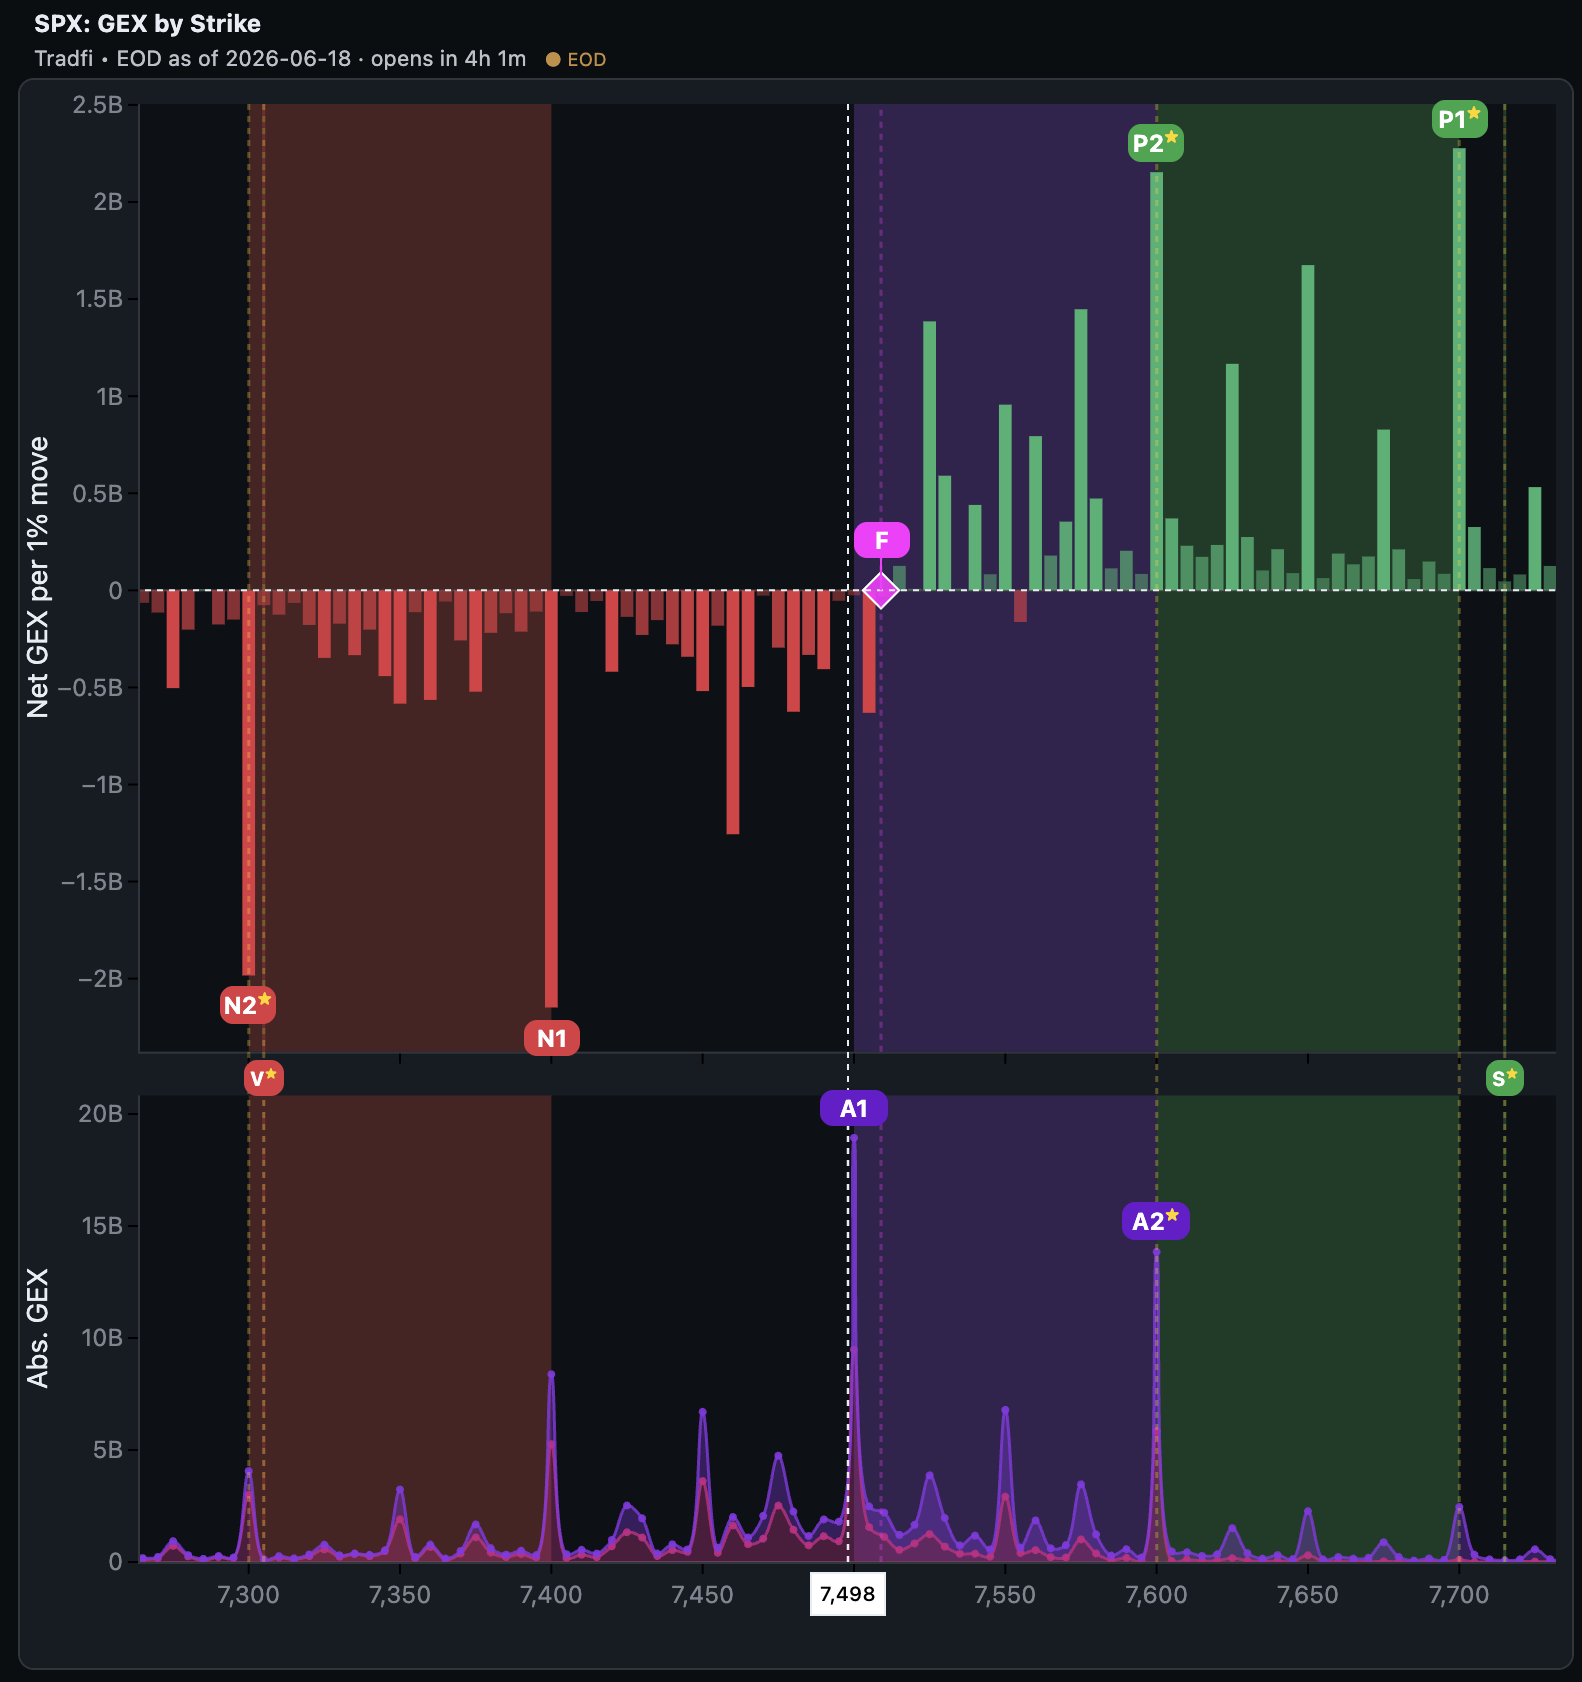 SPX through the full GEX lens — the same chart you know from crypto.
What's not here yet
Honesty round two: TradFi is daily-resolution for now. The intraday 1-hour OHLC view that crypto traders use is hidden for these tickers, because the underlying intraday history isn't in the feed yet. End-of-day strike data, term structure, heatmap history, and Monte Carlo are all fully live. Higher-resolution intraday is on the roadmap.
Try it
Open the context panel, flip to TradFi, and pick SPX. Watch the flip point, find the walls, run a Monte Carlo. If you already read crypto gamma, you already know how to read this — it's the same language, spoken in a new market.
Open the app and switch over.
Ready to see GEX in action?
Try GammaFlip.io and experience professional-grade gamma exposure analysis
Open Dashboard