
What Is Gamma Exposure in Crypto? A Trader's Guide
Why do some crypto price moves feel like they're moving through molasses, while others explode in minutes?
The answer often lies in a hidden force that most traders never see: Gamma Exposure (GEX).
If you've ever wondered why Bitcoin seems to "stick" at certain price levels, or why some breakouts accelerate violently while others fizzle out, understanding GEX might be the missing piece of your trading puzzle.
What Is Gamma Exposure?
Gamma Exposure measures the estimated hedging pressure that options market makers face when crypto prices move. Think of it as a force field around certain price levels that either:
- Stabilizes price (positive GEX) - like magnets pulling price back
- Destabilizes price (negative GEX) - like a snowball rolling downhill
Here's the key insight: When traders buy and sell options, market makers take the opposite side. To stay neutral, they constantly hedge by buying or selling the underlying crypto. This hedging activity creates predictable price dynamics.
A Simple Example
Let's say you're trading Bitcoin at $60,000:
Scenario 1: High Positive GEX
- Large call option positions exist at $60,000
- Market makers are long gamma (positive exposure)
- What happens?
- Price rises → Dealers sell BTC (take profit)
- Price falls → Dealers buy BTC (rebalance)
- Result: Price stabilizes around $60,000
Scenario 2: High Negative GEX
- Large put option positions dominate
- Market makers are short gamma (negative exposure)
- What happens?
- Price rises → Dealers buy more BTC (chase it up)
- Price falls → Dealers sell more BTC (accelerate down)
- Result: Price moves become explosive
Why Should Crypto Traders Care?
Understanding GEX gives you three major advantages:
1. Predict Volatility Regimes
- Positive Net GEX = Low volatility environment (price compression)
- Negative Net GEX = High volatility environment (explosive moves likely)
- Near Zero GEX = Gamma flip point (danger zone)
2. Identify Key Price Levels
- Put Walls: Strong support levels where dealers will buy dips
- Call Walls: Resistance levels where dealers will sell rallies
- Gamma Cliffs: Areas where small moves trigger massive hedging flows
3. Time Your Entries and Exits
- Enter positions near high GEX support levels (lower risk)
- Take profits at resistance levels backed by call GEX
- Reduce size when approaching negative GEX zones (higher volatility)
Real-World Example: The Anatomy of a Crypto Flash Crash
Imagine Bitcoin trading at $58,000 with these GEX conditions:
Strike Levels:
$62,000: +50M GEX (call wall - resistance)
$58,000: +20M GEX (current price - weak support)
$55,000: -80M GEX (put wall - but dealers are SHORT gamma)
$50,000: -120M GEX (massive negative zone)

Net GEX: -130M (dealers are NET SHORT GAMMA)
What this tells us:
- Current position is unstable (net negative GEX)
- $62K is strong resistance (dealers will sell into rallies)
- $55K-$50K is a danger zone (negative gamma accelerates moves)
- If price breaks $58K, dealers will SELL into the move, pushing it lower
- Volatility will spike once the move starts
Trading strategy:
- Reduce leverage in negative GEX environment
- Set tight stops above $58K support
- Expect explosive moves if $58K breaks
- Look for reversal signals only after reaching high positive GEX zones
How Is GEX Calculated?
The formula looks complex, but the concept is simple:
GEX = Gamma × Open Interest × Spot Price² × 0.01
Breaking it down:
- Gamma: How much delta changes per $1 price move
- Open Interest: Total number of option contracts
- Spot Price²: Squared to account for exponential hedging needs
- 0.01: Calculates exposure for a 1% price move
The critical assumption:
- Market makers are typically long calls (positive gamma)
- Market makers are typically short puts (negative gamma)
Therefore:
Net GEX = Call GEX - Put GEX
When puts dominate (like in our example above), Net GEX goes negative, signaling instability.
Understanding the Three Key GEX Metrics
When analyzing gamma exposure, you'll see three different metrics. Each tells you something different about market conditions:
1. Net GEX (The Direction Indicator)
Net GEX = Call GEX - Put GEX
What it tells you:
- Positive: Dealers are net long gamma → stabilizing force (low volatility)
- Negative: Dealers are net short gamma → destabilizing force (high volatility)
- Near Zero: Gamma flip point → unpredictable transition zone
Example:
Call GEX: +189M
Put GEX: -337M (displayed as 337M, but negative in calculation)
Net GEX: -148M
This indicates a high volatility regime where dealer hedging amplifies price moves.
2. Call GEX and Put GEX (The Level Indicators)
Individual gamma exposure from calls and puts at specific strike levels.
Call GEX (Positive):
- Represents dealer long call positions
- Creates resistance on the upside
- Dealers sell into rallies → stabilizing
Put GEX (Negative):
- Represents dealer short put positions
- Creates support on the downside (but can break violently)
- Dealers sell into dips → destabilizing
Use case: Identify specific support/resistance levels backed by gamma exposure.
3. Absolute GEX (The Magnitude Indicator)
Absolute GEX = Call GEX + Put GEX
What it tells you:
- Total magnitude of gamma exposure in the market
- Potential hedging flow volume regardless of direction
- Market friction or sensitivity to price moves
Why it matters:
High Absolute GEX (e.g., 500M+):
- Large potential hedging flows
- Market makers are highly sensitive to price moves
- Even small price changes trigger significant buying/selling
- More "friction" in the market
Low Absolute GEX (e.g., 100M):
- Smaller hedging flows
- Reduced dealer activity
- Price moves face less resistance from gamma hedging
- Less market structure influence
Critical Insight:
You can have two completely different market conditions with the same Net GEX:
Scenario A:
Call GEX: +300M
Put GEX: -350M
Net GEX: -50M (slightly negative)
Absolute GEX: 650M (HIGH)
Interpretation: High volatility regime (negative net) BUT with massive potential hedging flows. Expect explosive moves with strong reactions at key levels.
Scenario B:
Call GEX: +25M
Put GEX: -75M
Net GEX: -50M (same as above!)
Absolute GEX: 100M (LOW)
Interpretation: Same volatility regime (negative net) BUT with minimal hedging flows. Price can drift with less structural support/resistance.
Trading Application:
- High Absolute GEX: Trade key levels (put walls, call walls) - they matter more
- Low Absolute GEX: Trade technical patterns and fundamentals - gamma structure is weak
- Increasing Absolute GEX: Options activity growing → structure becoming more important
- Decreasing Absolute GEX: Options rolling off → structure weakening
Think of Absolute GEX as the "volume" of the gamma exposure force: - Net GEX tells you the direction of the force (stabilizing vs destabilizing) - Absolute GEX tells you the strength of the force (strong vs weak)
Two Types of GEX Analysis
1. GEX by Strike
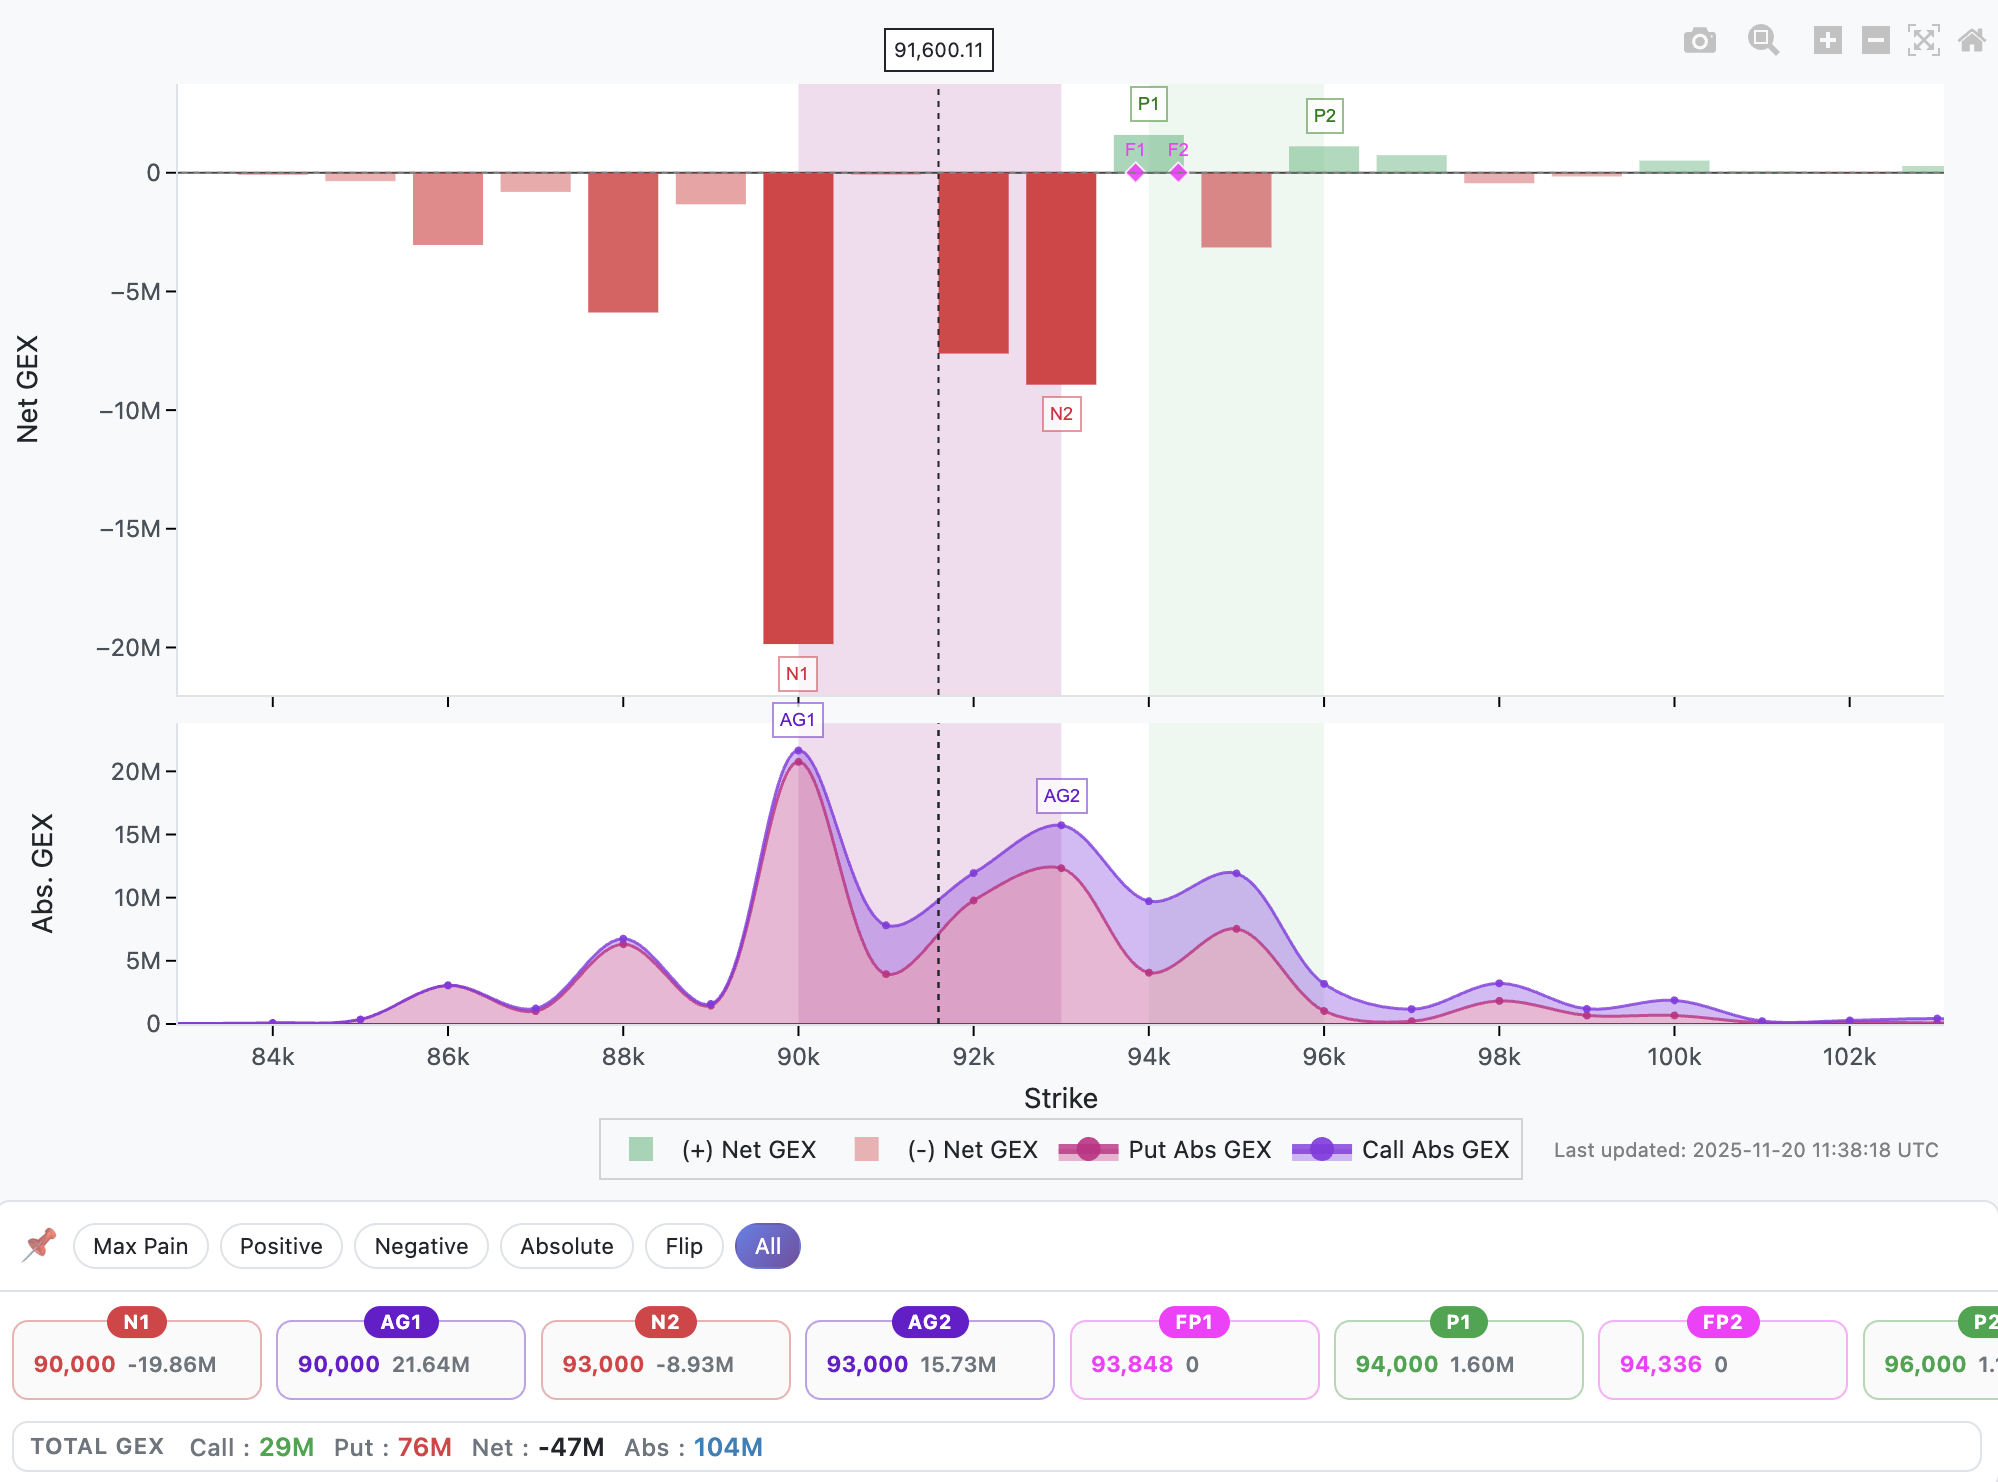 Shows gamma exposure at each strike price using current market data.
Best for:
- Finding support and resistance levels
- Identifying max pain zones
- Spotting put/call walls
2. Gamma Profile
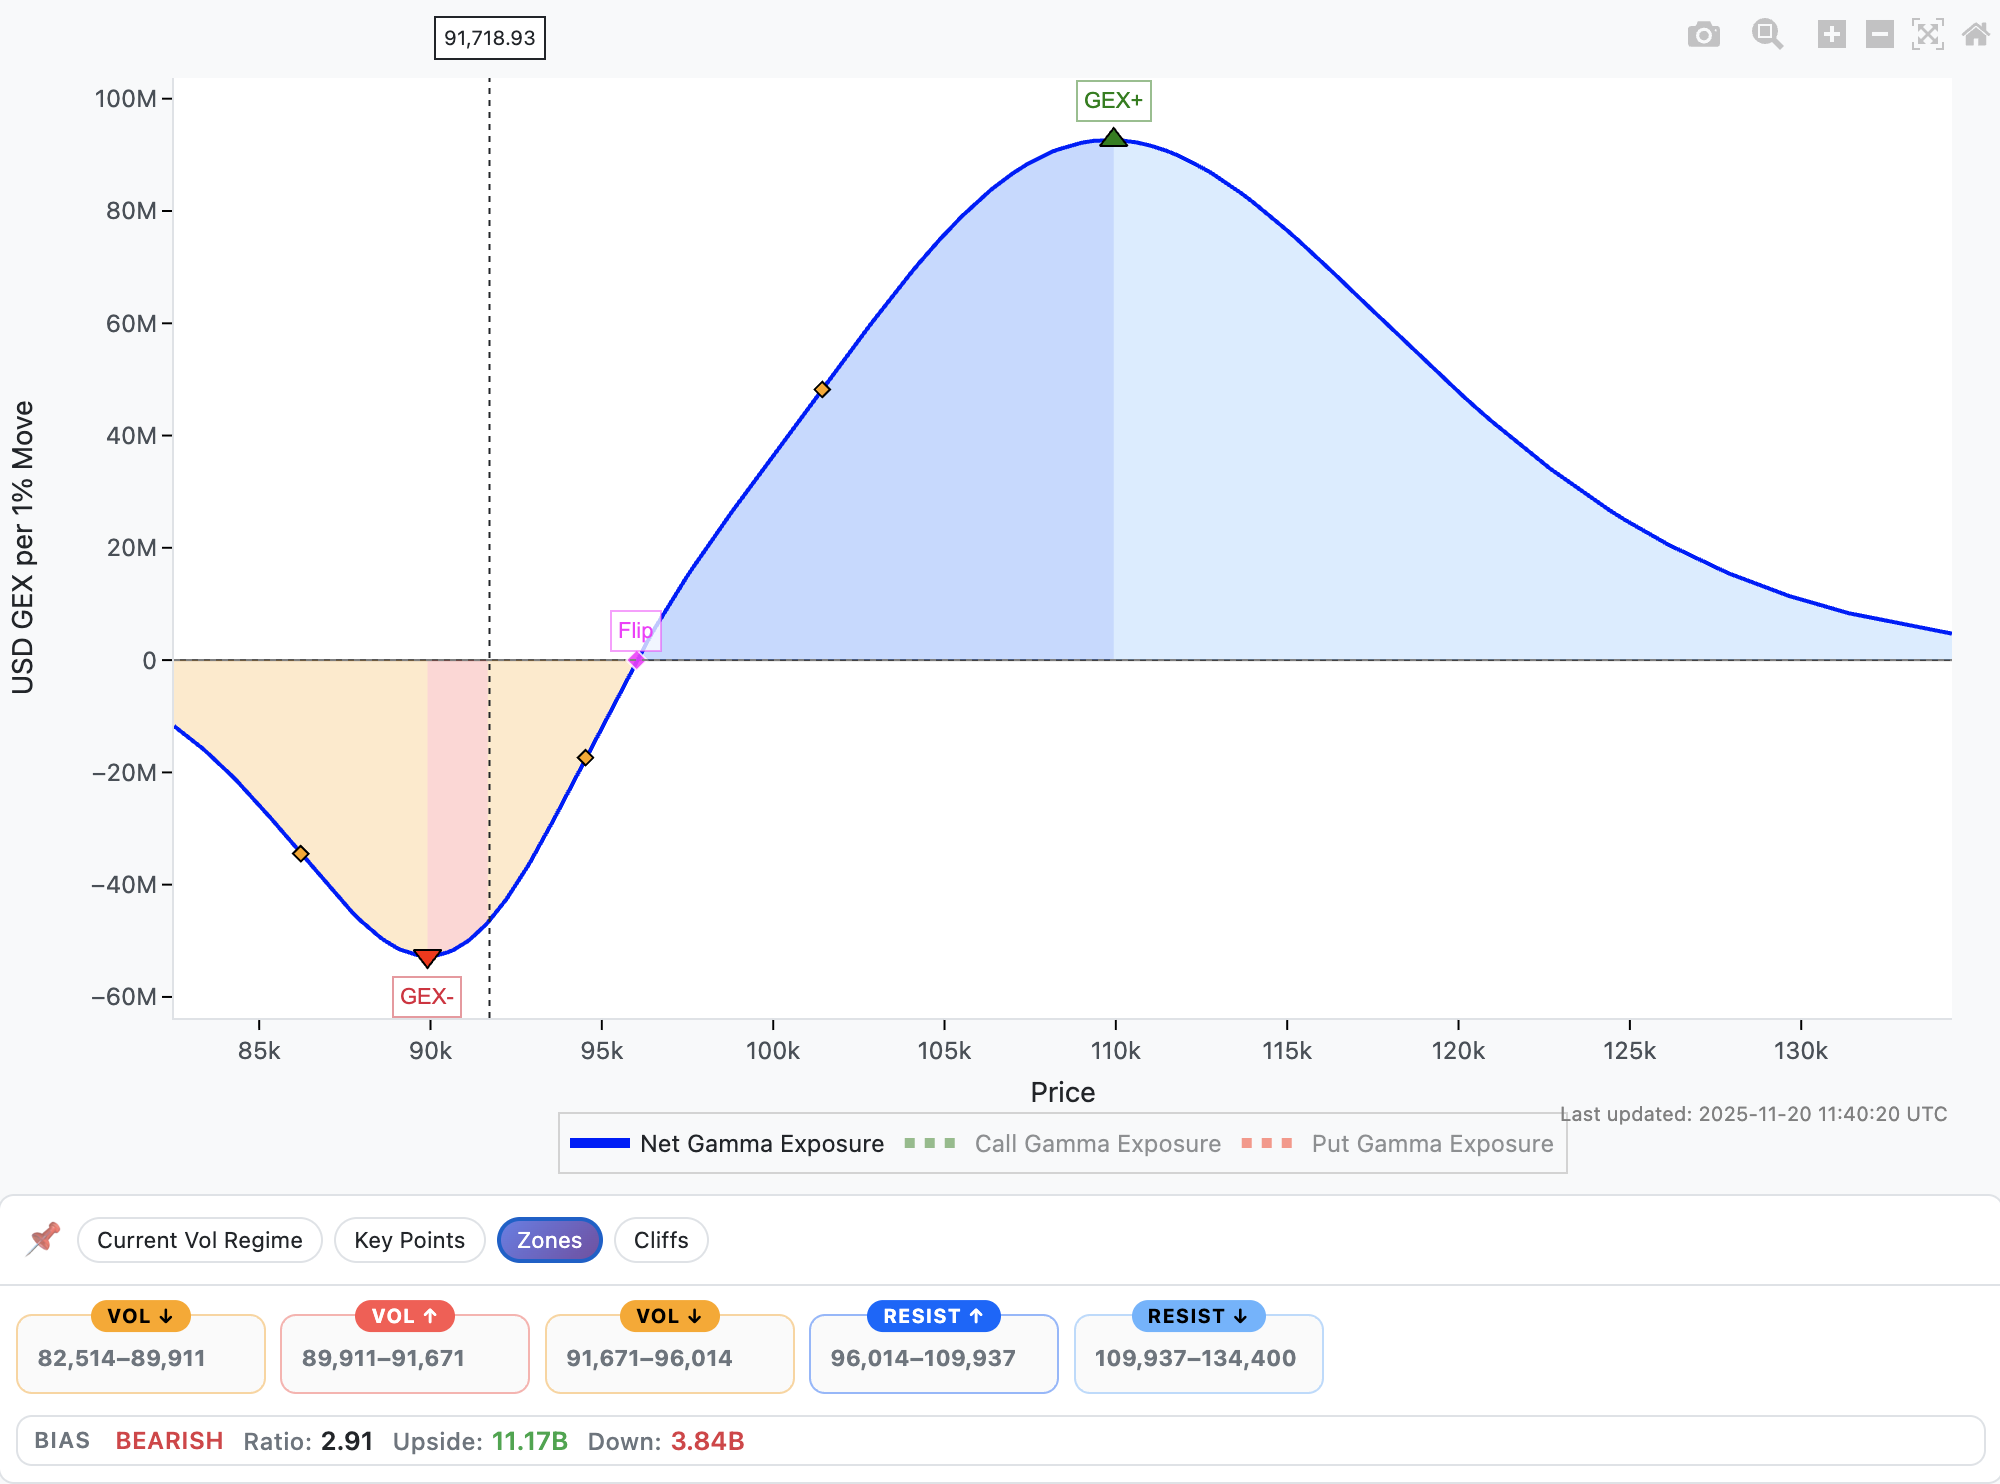
Shows how total gamma changes across a range of hypothetical prices.
Best for:
- Predicting hedging flows as price moves
- Finding gamma cliffs (explosive zones)
- Understanding positive/negative gamma zones
Pro tip: Use GEX by Strike to find key levels, then use Gamma Profile to understand what happens when price moves toward those levels.
Common Misconceptions
❌ "Negative GEX means price will go down"
Reality: Negative GEX indicates higher volatility, not direction. Price can explode in EITHER direction.
❌ "GEX predicts exact dealer positions"
Reality: GEX is an assumption-based proxy. We don't have actual dealer position data. It's a powerful estimate, not gospel.
❌ "Higher GEX values are always better"
Reality: High positive GEX means stability (good for selling options), while high negative GEX means volatility (good for directional trades or buying options).
How Professional Traders Use GEX
Strategy 1: Mean Reversion in Positive GEX Zones
Setup: Net GEX = +200M, BTC at $60K
Entry: Price drops to $59K (oversold)
Thesis: Dealers will buy the dip to rebalance
Target: Return to $60K
Risk: Low (positive gamma stabilizes)
Strategy 2: Breakout Trading in Negative GEX Zones
Setup: Net GEX = -150M, BTC at $58K
Entry: Break below $57K with volume
Thesis: Dealers will sell into the move, accelerating it
Target: Next positive GEX zone at $54K
Risk: High (use tight stops and smaller size)
Key Takeaways
- GEX measures market maker hedging pressure - a hidden force that drives price dynamics
- Positive GEX = stability, Negative GEX = volatility - not directional prediction
- Put walls and call walls create support/resistance - backed by dealer hedging flows
- Gamma cliffs are danger zones - avoid or exploit with caution
- Net GEX helps you adjust risk - larger positions in stable regimes, smaller in chaotic ones
The Bottom Line
Gamma Exposure isn't a crystal ball, but it's one of the most powerful structural indicators available to options traders. While most traders are staring at RSI and moving averages, you can see the actual hedging flows that move markets.
The difference between knowing that Bitcoin is at $60K and understanding that it's sitting on -$150M of negative gamma could be the difference between getting stopped out and catching a 10% move.
Disclaimer: This article is for educational purposes only. Gamma Exposure analysis is a tool, not a guarantee. Always do your own research and manage risk appropriately. Options trading carries significant risk and is not suitable for all investors.
Ready to see GEX in action?
Try GammaFlip.io and experience professional-grade gamma exposure analysis
Launch App