Why Gamma Exposure Numbers Differ Across Platforms — And Why That's OK
If you've ever compared GEX charts across different analytics platforms, you've probably noticed something unsettling: the numbers don't match.
The shapes look similar, but the Y-axis scale can differ by 2-5x, and even key levels like the gamma flip point land at different prices. Does that mean someone is getting it wrong?
Not necessarily. Here's what's actually going on.
The Formula Everyone Agrees On
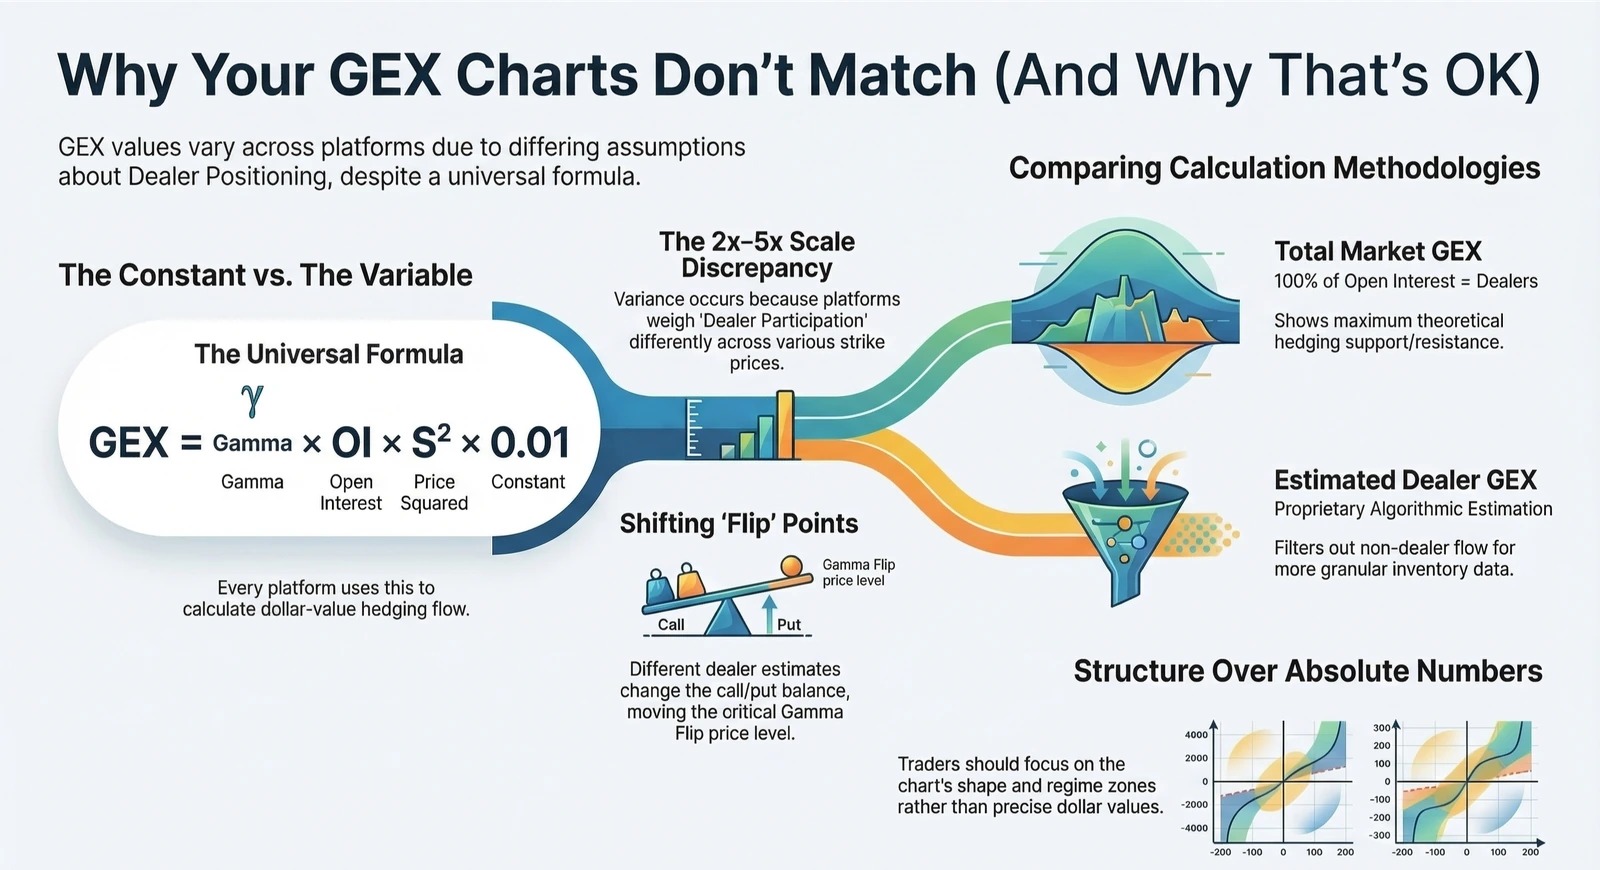
At its core, every serious GEX platform uses the same building block:
GEX = Gamma × OI × S² × 0.01
Where Gamma is the Black76 option gamma, OI is open interest, S is the spot price, and 0.01 represents a 1% move. The result is the dollar value of delta-hedging flow that would be triggered if the underlying moves by 1%.
The gamma itself comes from the standard formula — N'(d1) / (S × σ × √T) — and is consistent across platforms. Deribit publishes it in their API, and any Black76 model will reproduce the same values.
So if the formula is the same, where does the disagreement come from?
The Dealer Positioning Assumption
This is where platforms diverge — and it makes all the difference.
The standard approach
Most GEX tools — including GammaFlip, SpotGamma, and Perfiliev Financial — make a simplifying assumption: all open interest represents dealer exposure. Every call contract has a market maker on the short side. Every put contract has a market maker on the long side.
Call gamma is positive (stabilizing). Put gamma is negative (destabilizing). Net GEX is the difference.
This gives you the total market gamma exposure — the maximum theoretical hedging flow if every contract required dealer hedging.
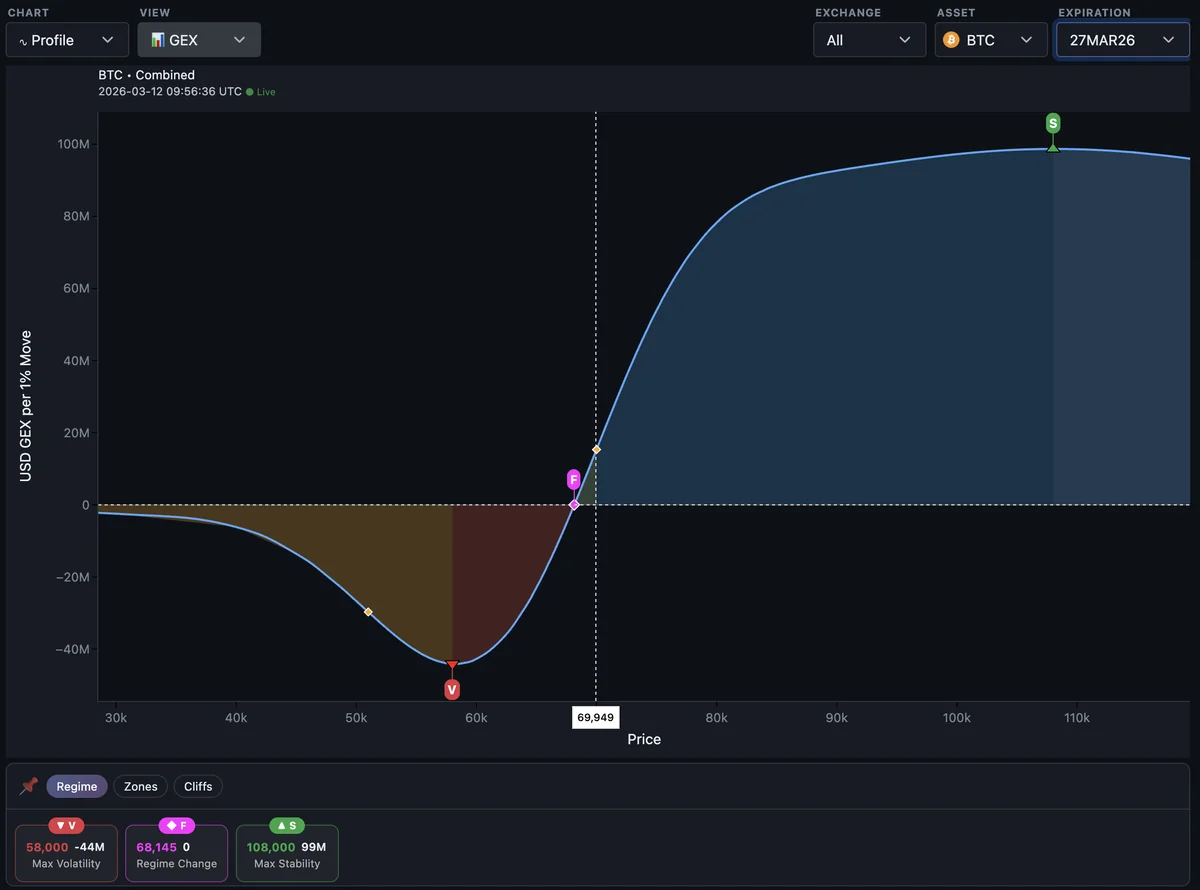 GammaFlip's gamma profile for BTC 27MAR26 expiration — based on 100% open interest
The estimated-dealer approach
Some platforms, like Amberdata, take a different route. Their proprietary algorithms analyze individual trades against millisecond-level order book snapshots to estimate which side of each trade is the dealer. Instead of assuming 100% of OI is dealer-facing, they estimate the actual market maker inventory at each strike.
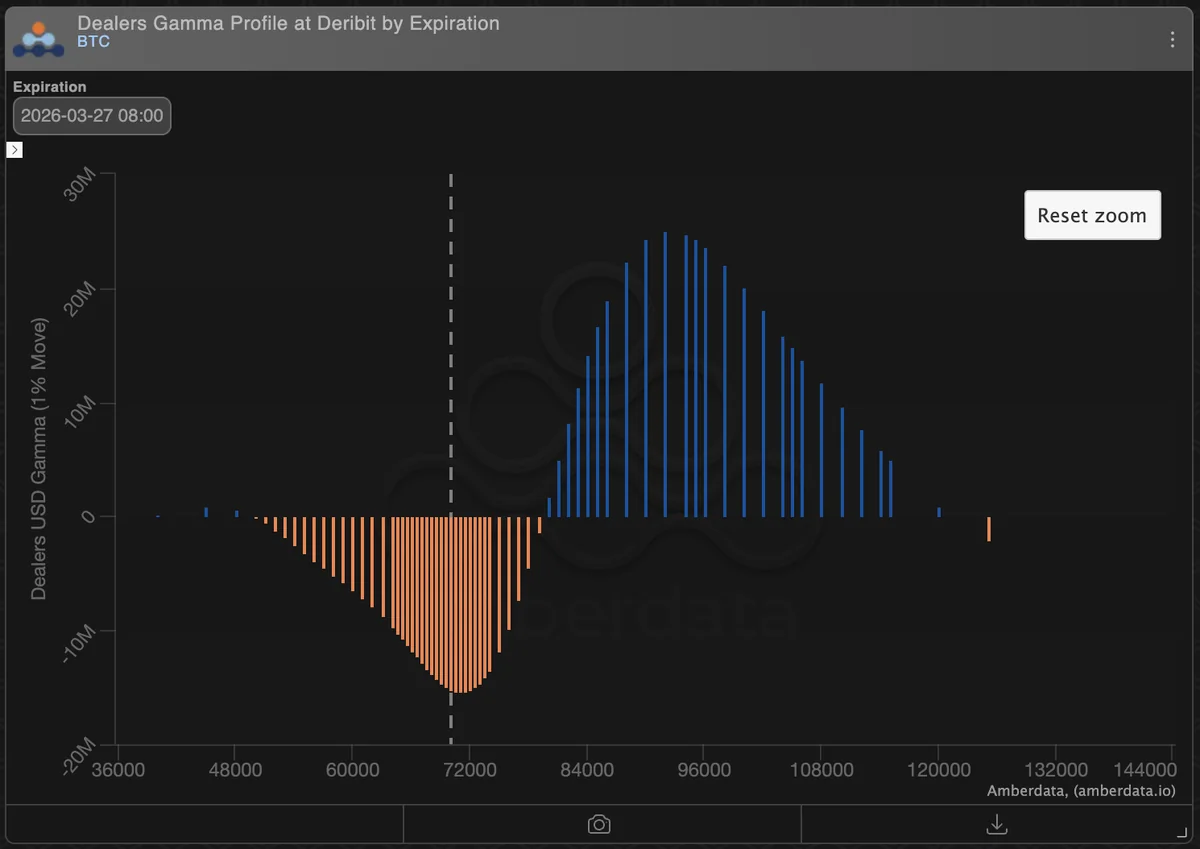 Amberdata's dealer gamma profile for the same expiration — based on estimated dealer positions
Since dealers typically hold only a fraction of total open interest, these values are proportionally smaller.
Why the Ratio Isn't Constant
You might expect a clean 3x or 4x difference across the board. But the ratio actually varies by strike — anywhere from 2x to 5x or more.
The reason: dealer participation isn't uniform. Market makers tend to dominate liquidity at near-the-money strikes, but hold a smaller share of far OTM positions that are often driven by institutional hedging or speculative flow.
This also explains why key levels differ between platforms — not just in magnitude, but in location. The gamma flip point — the price where net GEX crosses zero and the market shifts from stabilizing to destabilizing regime — can land at noticeably different prices. In our BTC 27MAR26 comparison, the flip point appeared near 68,000 on GammaFlip and between 79,000–80,000 on Amberdata — a significant gap.
The reason is straightforward: different dealer position estimates change the call/put GEX balance at each strike, which shifts where the net GEX curve crosses zero. The same logic applies to max stability and max volatility zones — they move because the underlying weights have changed, not because anyone's math is wrong.
Which Approach Should You Use?
Neither is "wrong." They answer different questions:
-
Total market GEX (our approach) shows the theoretical maximum hedging pressure at each price level. It's useful for understanding market structure and identifying where gamma concentration creates support or resistance.
-
Dealer-estimated GEX attempts to isolate the actual market-maker hedging component. It's more granular in theory, but depends entirely on the accuracy of trade classification algorithms.
For most practical purposes — identifying the general flip zone, spotting high-gamma strikes, understanding whether the market is in positive or negative gamma territory — both approaches tell a similar story. The broad structure is the same, even if the exact flip price and peak magnitudes differ.
The Key Takeaway
When comparing GEX across platforms, focus on the relative structure, not the absolute numbers. A gamma flip at 68,000 on one platform and 79,000 on another both signal a regime change zone — the exact price differs because each platform weights dealer exposure differently.
Similarly, a chart showing 90M and another showing 30M at the same price level are describing the same market force — just calibrated to different assumptions about who's on the other side of the trade. The direction of the hedging pressure is what matters for your trading, not the precise dollar amount.
Ready to see GEX in action?
Try GammaFlip.io and experience professional-grade gamma exposure analysis
Open Dashboard