The Single-Lens Problem
Most traders rely on a single analytical approach: technical patterns, on-chain metrics, or derivatives positioning. Each method offers valuable insight, but in isolation, each has blind spots. Technical analysis can miss underlying capital flows. On-chain data doesn't capture short-term dealer dynamics. Options positioning lacks context about long-term holder behavior.
What if we could layer all three?
This article introduces a multi-dimensional framework that combines gamma exposure (GEX) from options markets, on-chain metrics tracking capital deployment, and technical analysis identifying key price structures. When all three forces align, the resulting signals carry exceptional conviction.
We'll demonstrate this using live Bitcoin analysis based on data from February 8, 2026, focusing on the February 13, 2026 expiration. At the time of analysis, BTC traded at $70,249-$71,500 following a sharp decline from all-time highs.
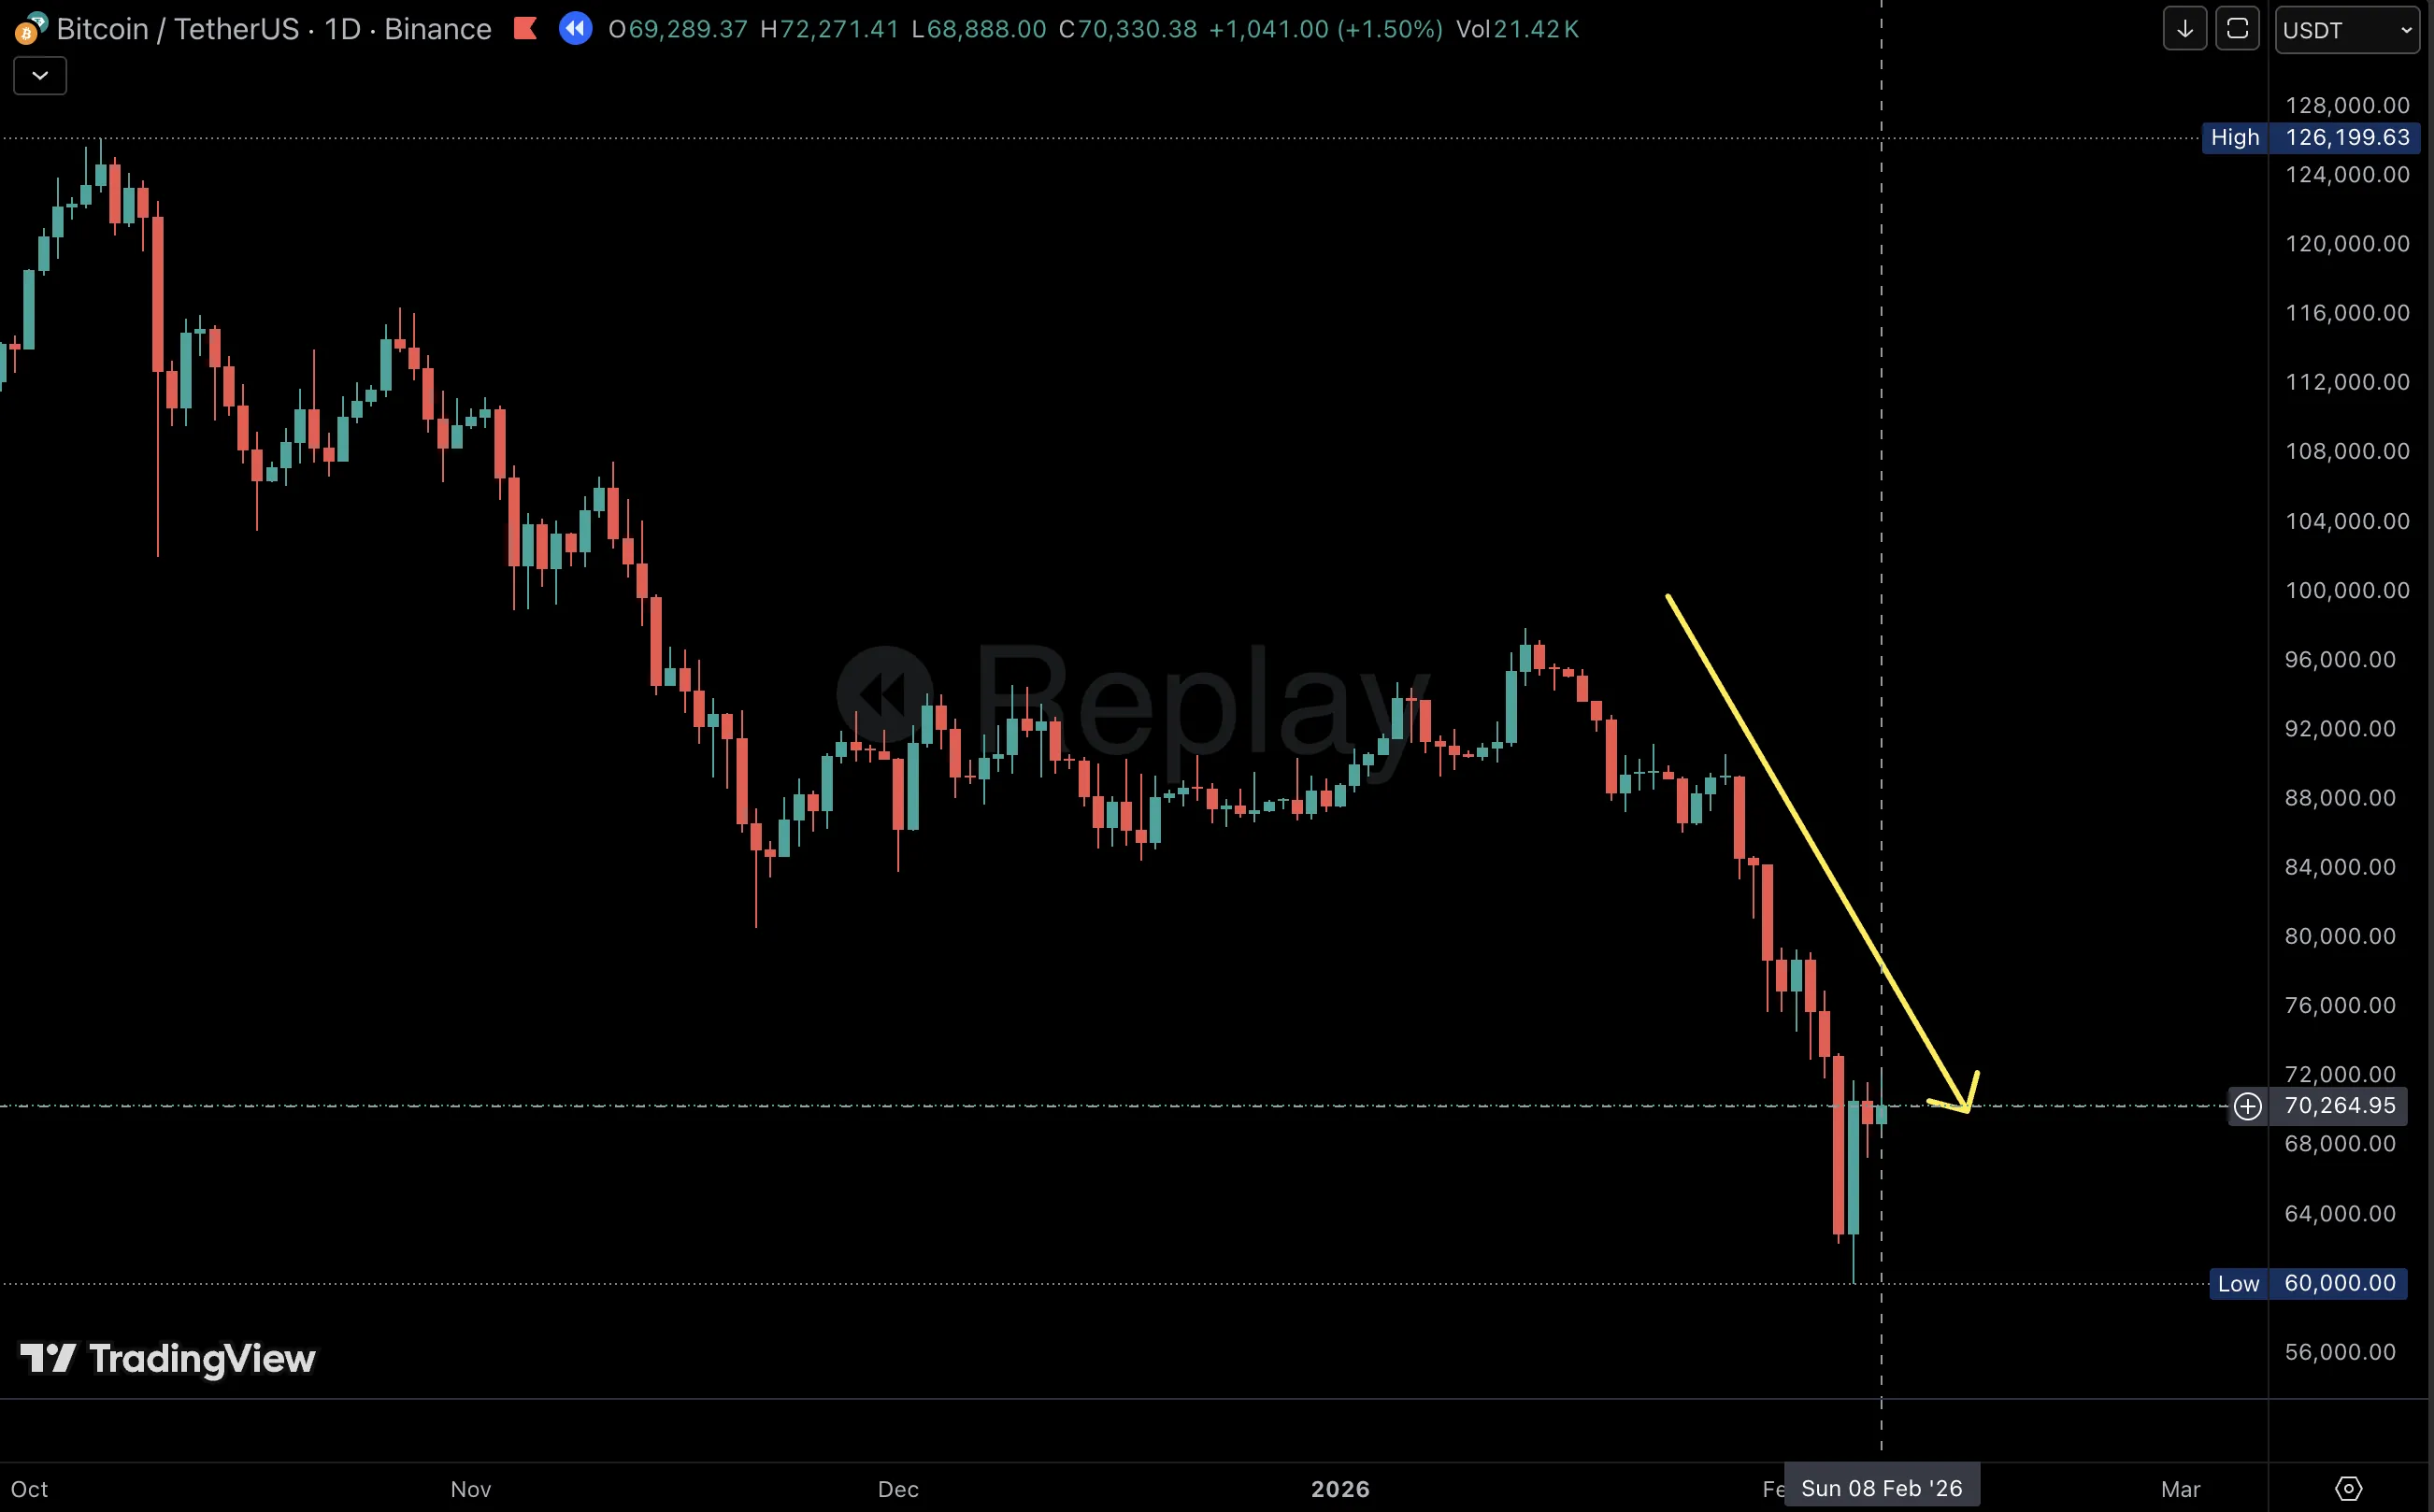 Bitcoin's decline from $99k to $59.8k and subsequent bounce to $70k range
gex
Bitcoin's decline from $99k to $59.8k and subsequent bounce to $70k range
gex
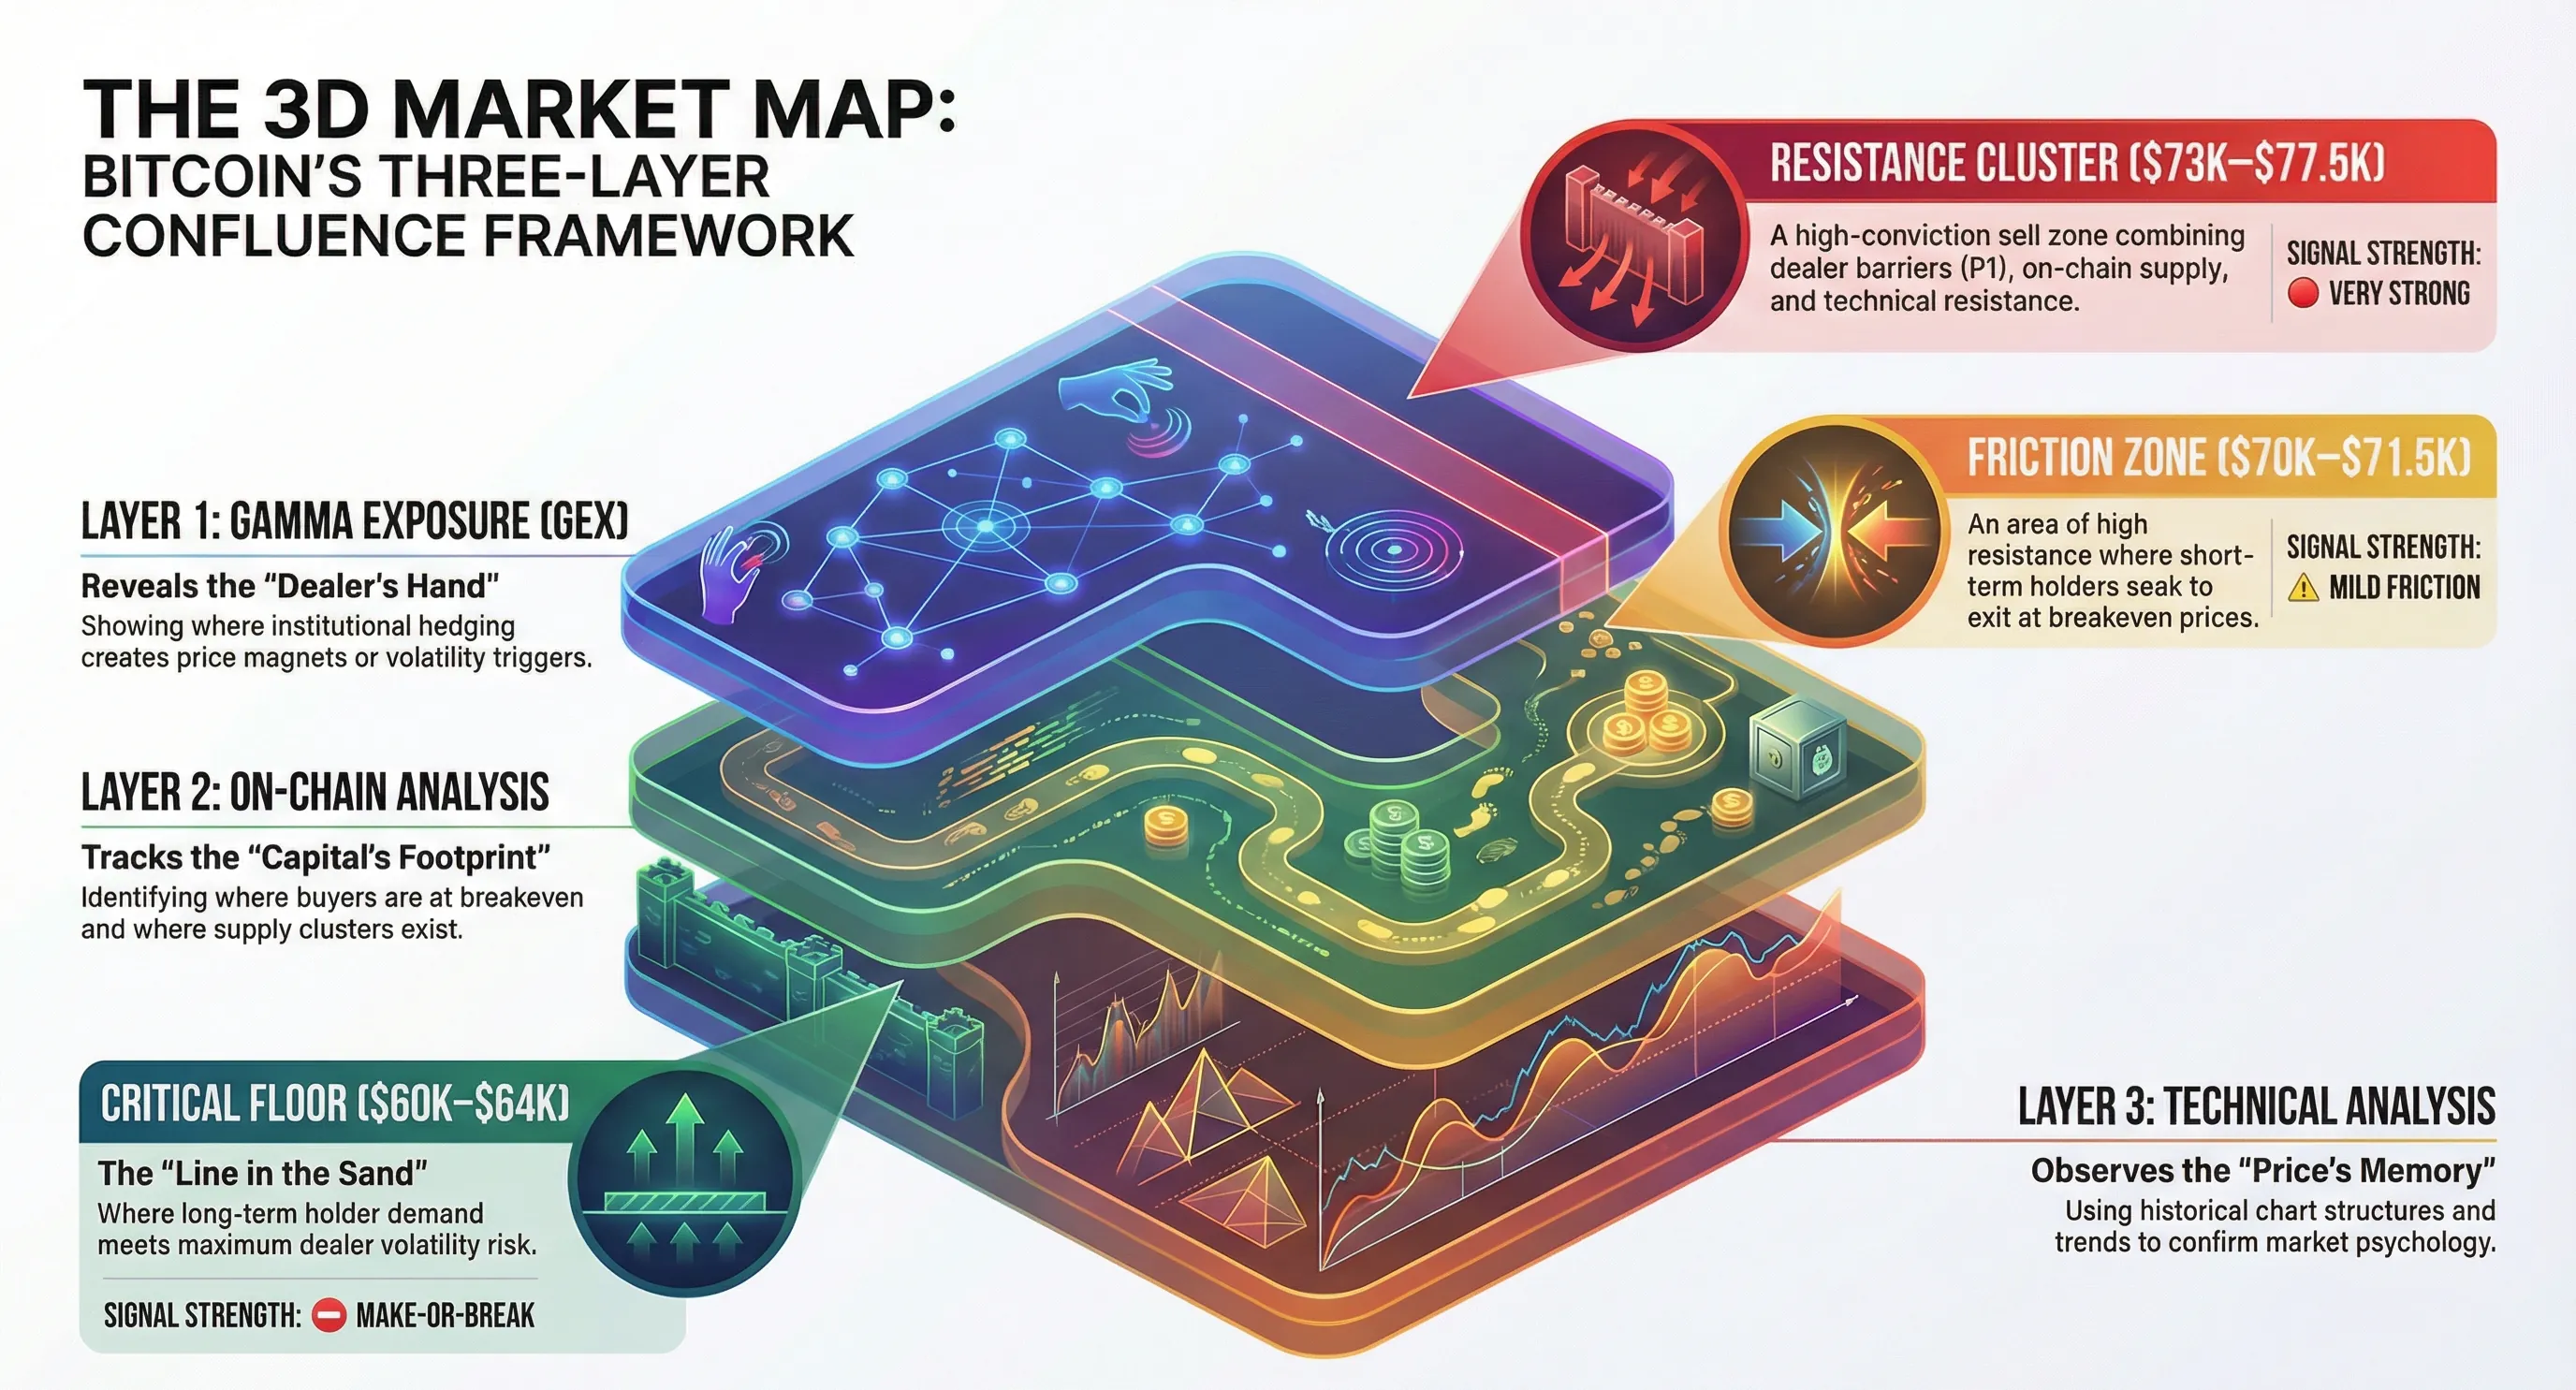
The Three Analytical Layers
Layer 1: Gamma Exposure (GEX) — The Dealer's Hand
Options dealers hedge their exposure by buying or selling spot, creating predictable price behavior around key levels:
- Positive Gamma (P1,P2): Dealers stabilize price (buy dips, sell rallies)
- Negative Gamma (N1,N2): Dealers amplify moves (sell dips, buy rallies)
- Flip Point (FP): The regime boundary between positive and negative gamma
- Absolute Gamma (A1,A2): The strongest price magnet
- Max Volatility (V): Where dealer hedging accelerates price cascades
What it reveals: Where institutional hedging creates support, resistance, and volatility triggers.
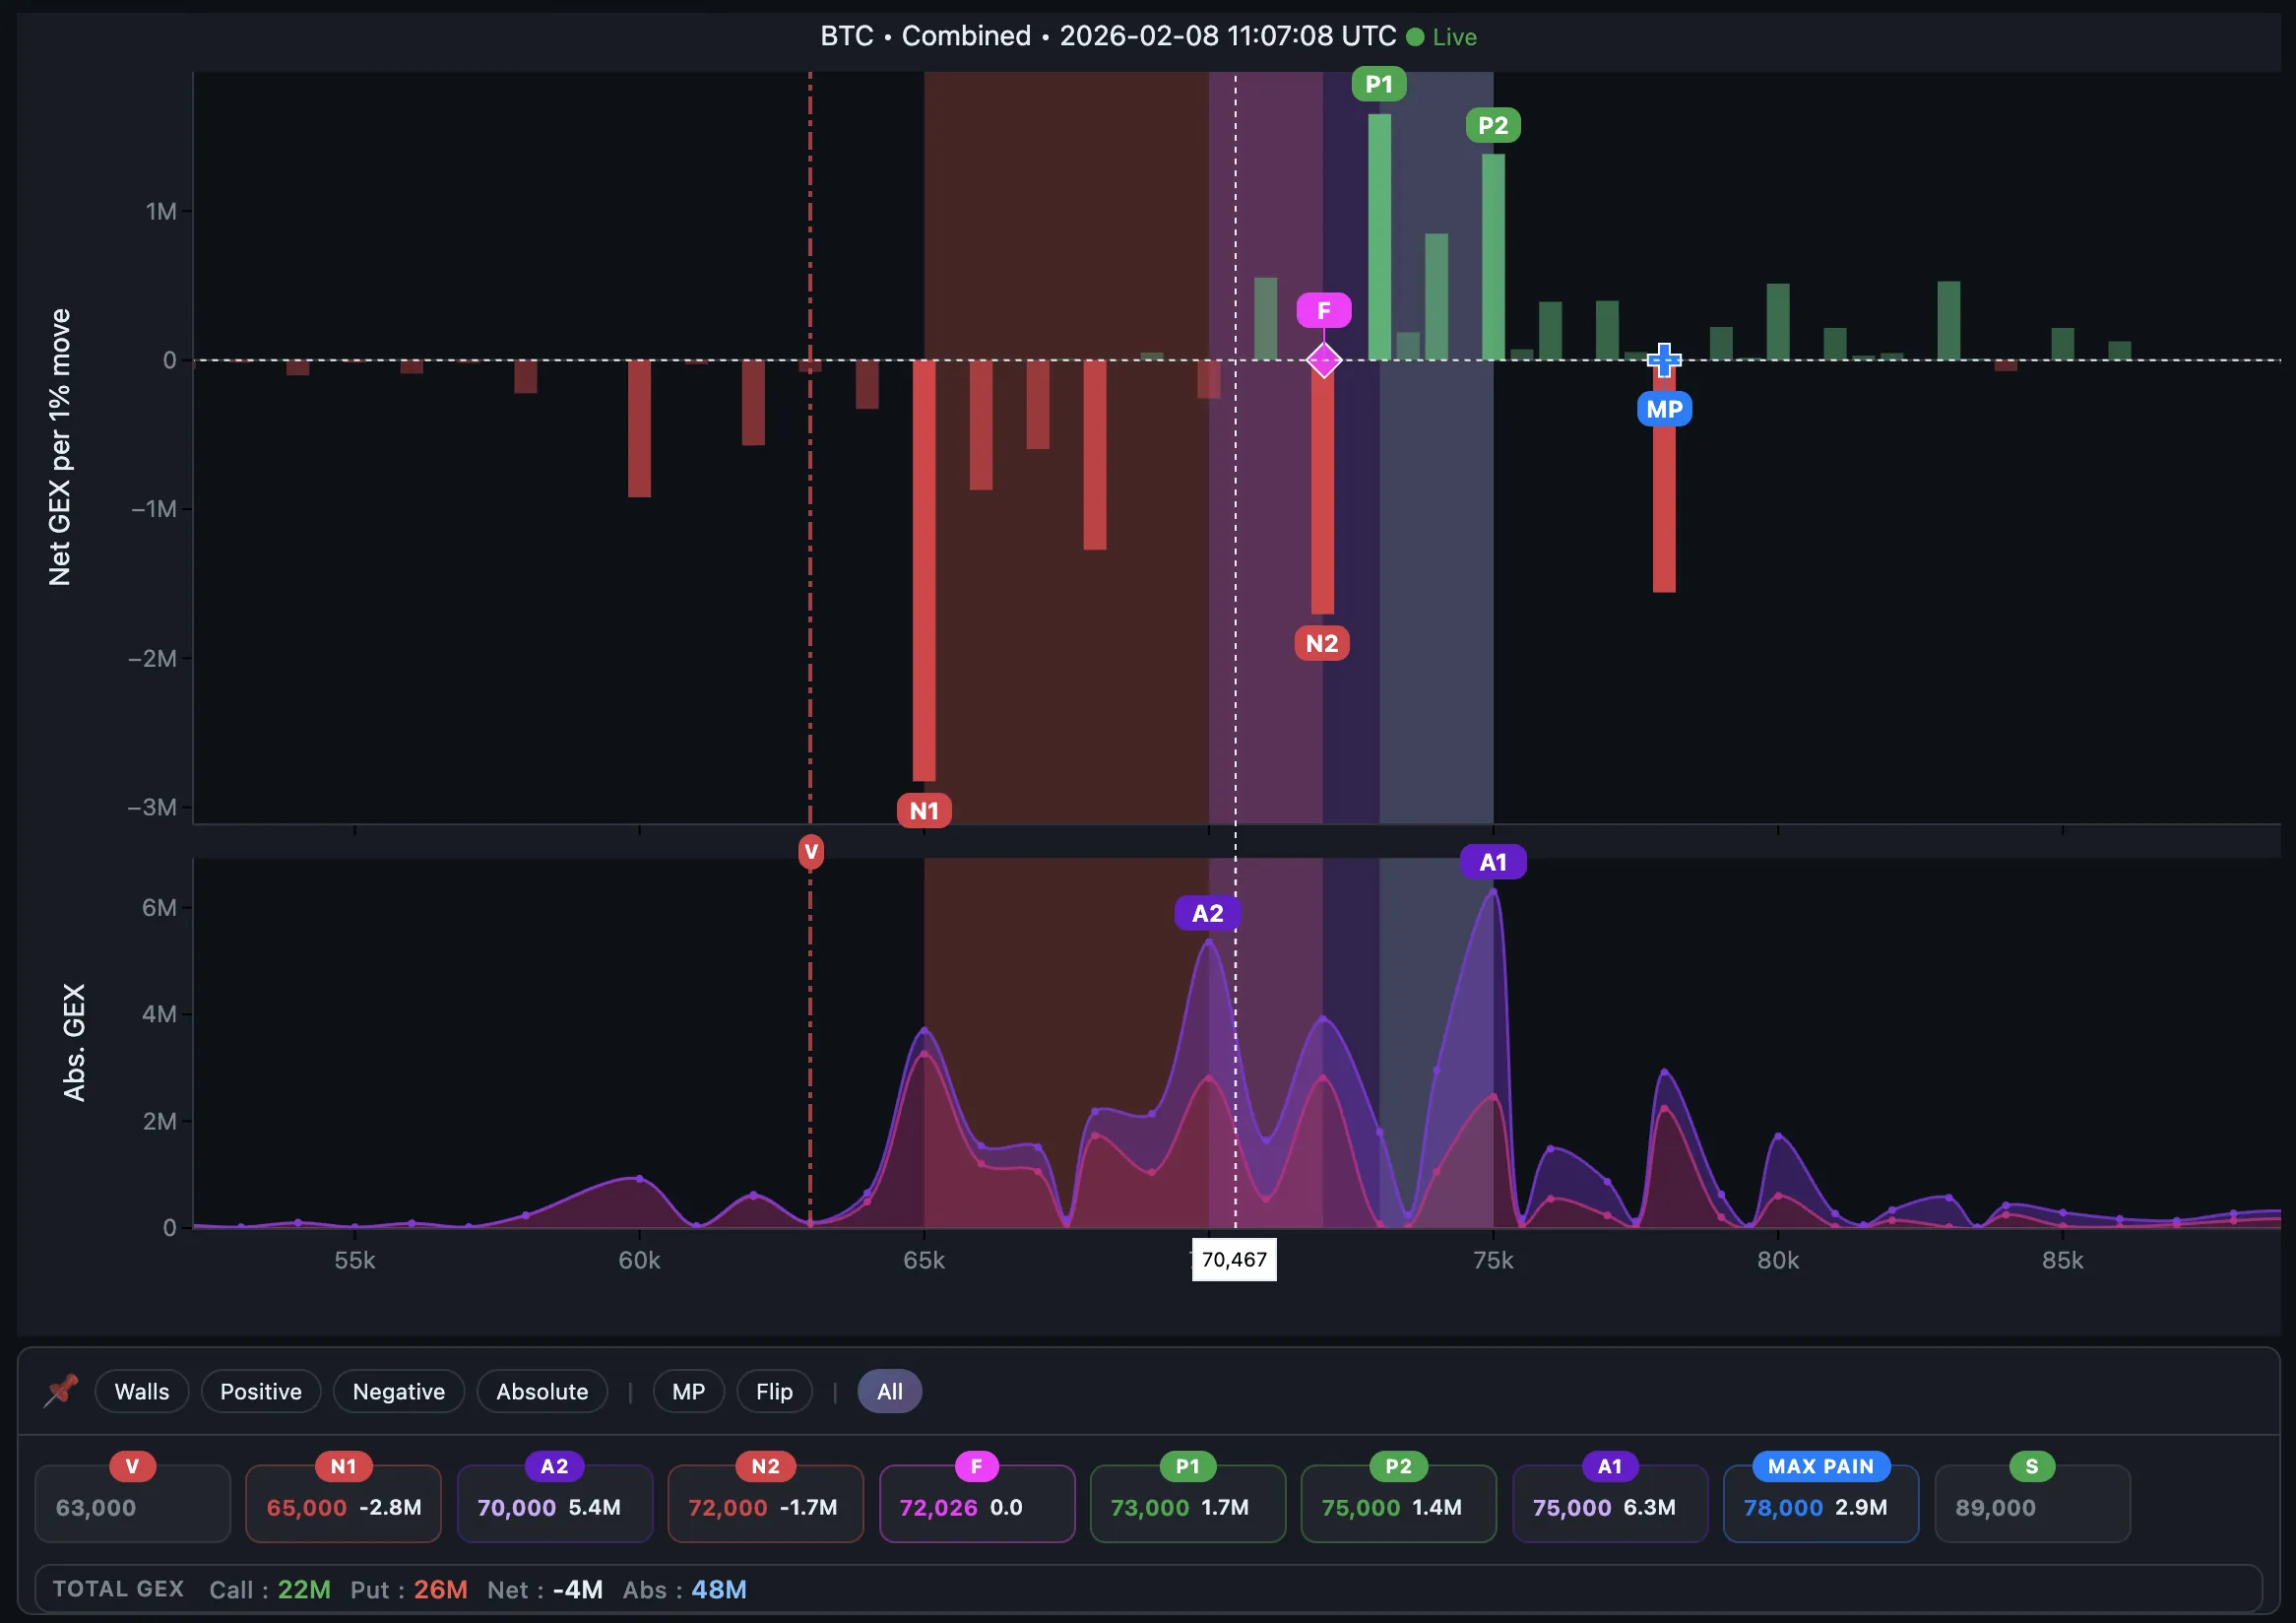 Gamma exposure profile showing key levels for 13FEB26 expiration
Layer 2: On-Chain Analysis — The Capital's Truth
Blockchain data allows us to look past price action and see the actual capital deployment. When we analyze the on-chain layer, we focus on two primary concepts: supply distribution (URPD) and the market's collective cost basis.
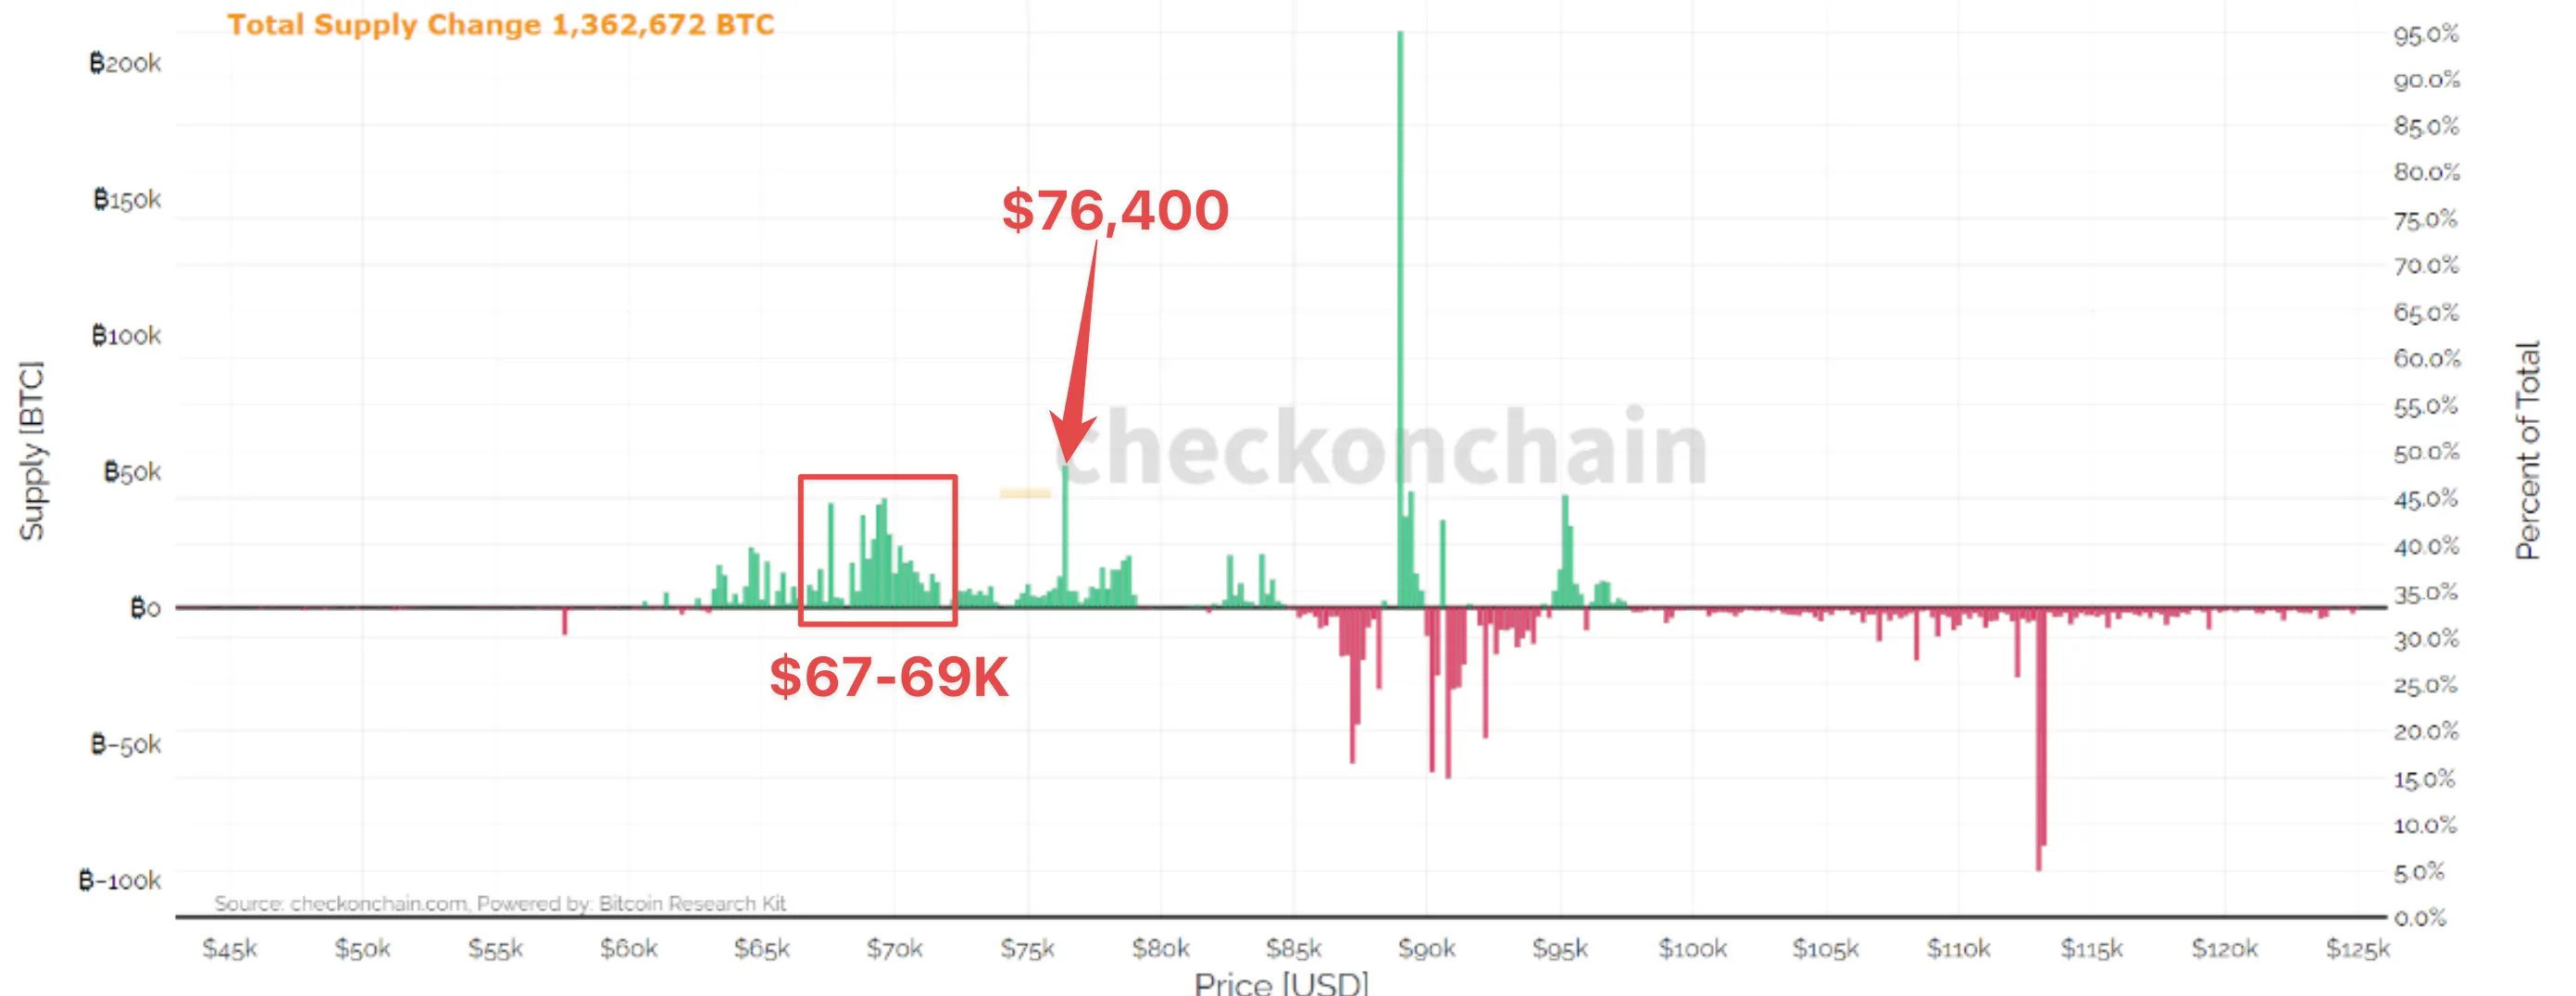
1. URPD: The Distribution of Supply
URPD (UTXO Realized Price Distribution) visualizes where every Bitcoin last moved on the blockchain. It effectively maps the "buy walls" and "sell walls" based on actual capital deployment rather than just order book depth.
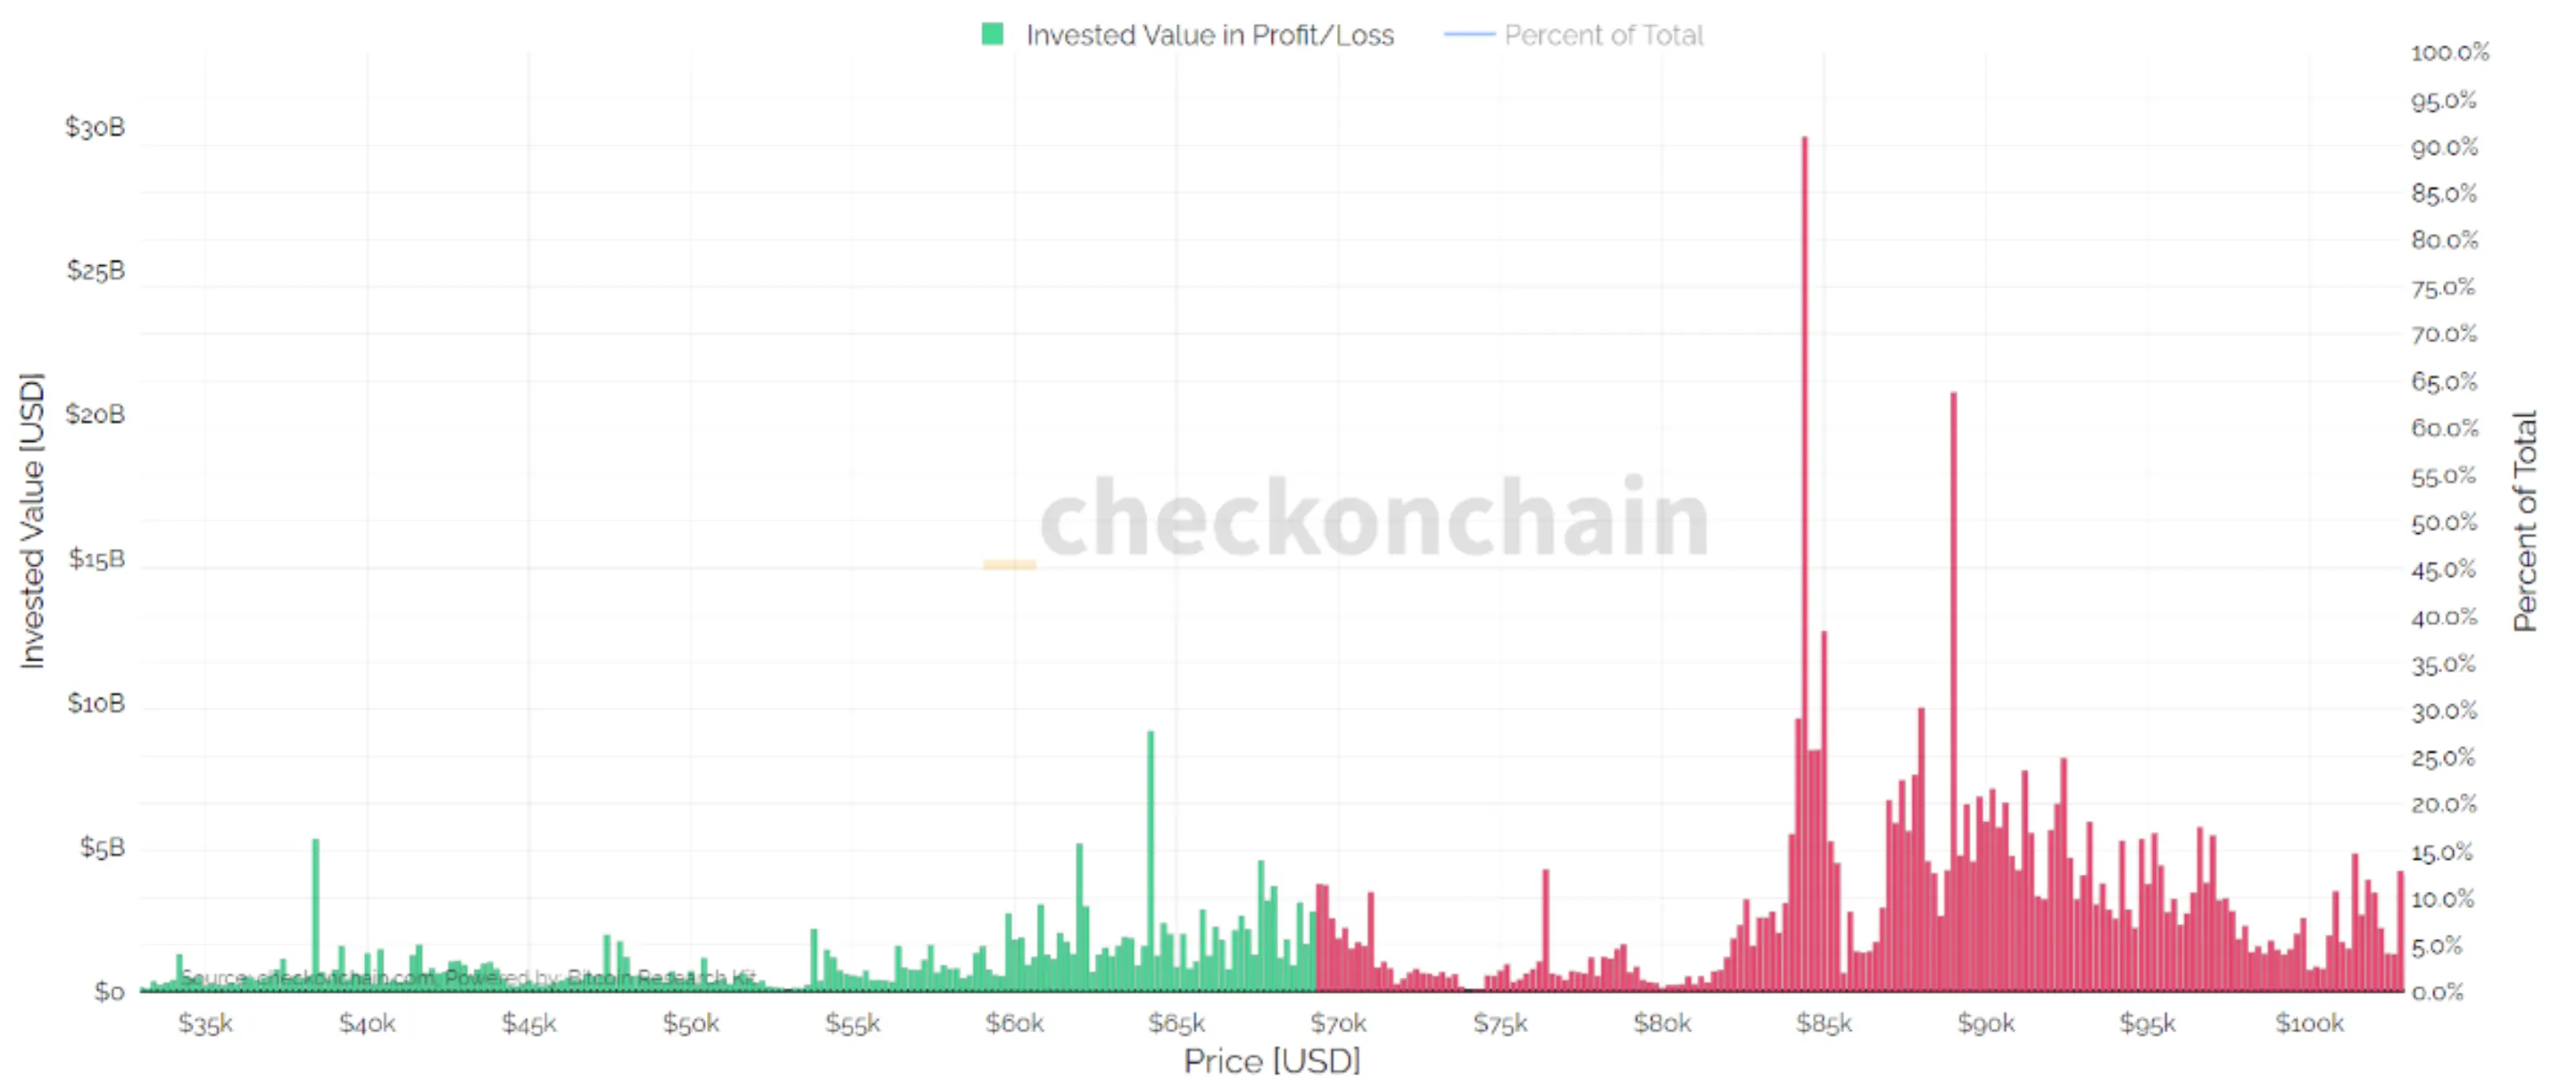 Current URPD distribution showing concentration points
By analyzing changes over the last 30 days, we can identify where new clusters are forming. For instance, new accumulation between $67K–$69K suggests buyers are stepping in on the dip, while a resistance cluster at $76,400 marks where recent buyers are currently underwater.
 Changes in realized price distribution over the last 30 days
2. Cost Basis: The Average Entry Price
If URPD tells us where people bought, Cost Basis tells us their average psychological breakeven point.
What is Cost Basis?
The volume-weighted average price at which a specific cohort of market participants last moved their coins on-chain, effectively representing their average entry price.
7D Cost Basis: $70,916 | 30D Cost Basis: $82,077
What it reveals: Structural support/resistance based on holder psychology. Participants are most likely to react (sell or defend) when price returns to their average entry level.
Layer 3: Technical Analysis — The Price's Memory
Chart patterns, swing highs/lows, and horizontal levels that price respects:
- Support/Resistance zones: Historical reaction points
- Trend structure: Identifying regime (bullish/bearish/range)
- Momentum: Measuring strength of moves
What it reveals: Market psychology, trader positioning, and probable reaction zones.
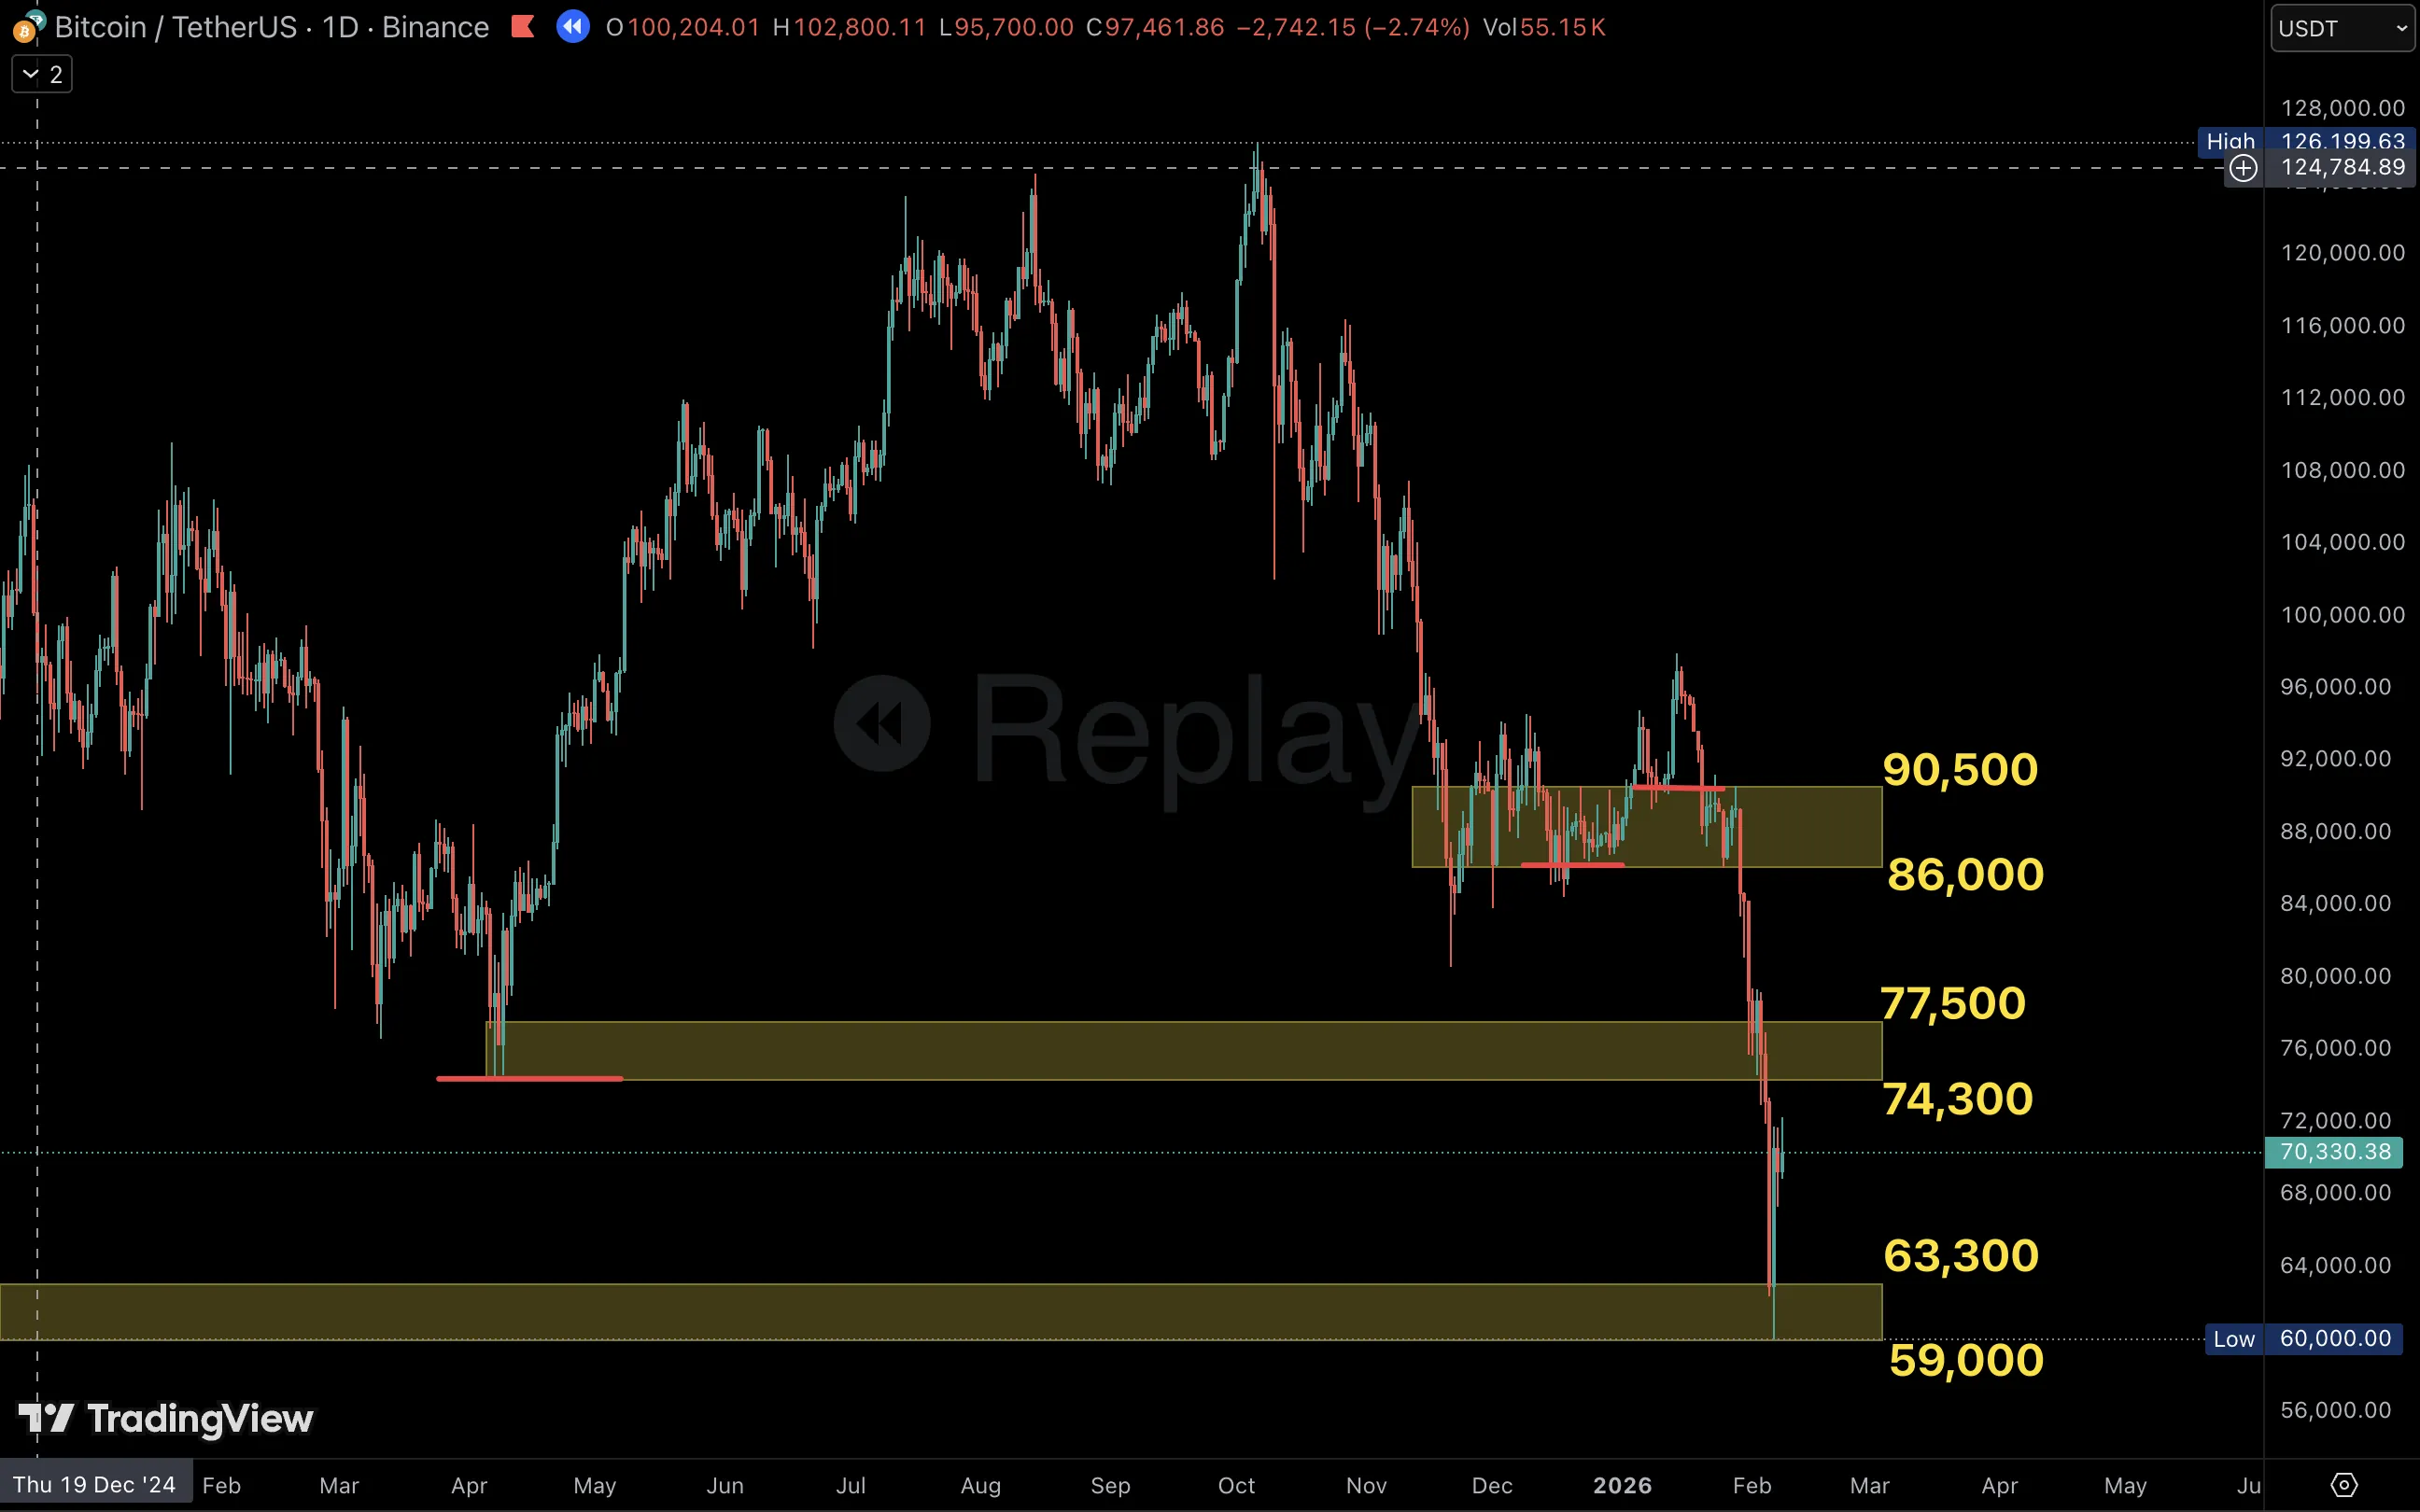 Key resistance at $74k-$77.5k, support structure at $59k-$63.3k
13 Feb 2026 Expiration: Live Confluence Analysis
Market Context
Bitcoin dropped from $99,000 to $59,800 in late January, then bounced to $70,000-$71,500 by February 8. The market faced three critical questions:
- Is this a reversal or just a relief bounce?
- Where will resistance emerge?
- What levels are critical to hold?
Let's examine what each analytical layer revealed — and where they aligned for the upcoming Feb 13 expiration.
The Four Confluence Zones
Zone 1: $70,000-$72,000 — The Friction Zone
GEX Perspective:
- Flip Point at $72,026 (13FEB26) — critical regime pivot
- Price below FP = Negative Gamma regime (dealers amplifying downside moves)
- A2 magnet at $70,000 creating natural support and gravitational pull
- Net GEX: -4M (small negative), indicating trending/volatile behavior
On-Chain Perspective:
- 7-day cost basis: $70,916 (short-term holders at breakeven)
- High realized losses observed during the decline
- Implication: Breakeven sellers waiting to exit
Technical Perspective:
- Price trading below the key $74,000-$77,500 resistance zone
- No major structural resistance identified in this consolidation
- Any friction here is interim before testing the main supply block
The Confluence: All three layers currently suggest friction in the $70k-$71.7k area. While technical analysis didn't explicitly define this as a rejection zone, the options and on-chain data point to price friction or mild rejection here rather than a hard stop. GEX shows dealers may amplify weakness below the flip point, and short-term holders may exit at breakeven.
Trading Implication: Price likely to encounter friction here. Bearish bias hinted by negative gamma regime, but not a major reversal zone yet.
Zone 2: $73,000-$77,500 — The Resistance Cluster
GEX Perspective:
- P1 resistance at $73,000 (Positive Gamma 1)
- P2 resistance at $75,000 (Positive Gamma 2)
- A1 (Absolute Gamma) at $75,000 — the strongest magnet on the board
- Max Pain (MP) at $78,000 — acting as a final gravity well for expiration
On-Chain Perspective:
- URPD shows mild supply cluster at $76,400
- Recent accumulation between moves created supply pockets here
Technical Perspective:
- Primary resistance zone: $74,000-$77,500
- Technical analysis shows this as key rejection area
- Break above $77.5k needed for bullish continuation
The Confluence: This zone combines dealer resistance (P1), on-chain supply distribution, and technical resistance walls.
Trading Implication: If price reaches this zone, expect heavy selling pressure from multiple participant groups. High-conviction resistance area.
Zone 3: $65,000-$69,000 — The Reaction Zone
GEX Perspective:
- N1 volatility trigger at $65,000 (Negative Gamma 1)
- Critical Warning: N1 is NOT support — it's where dealer selling accelerates
- Break below N1 triggers cascade toward V (Max Volatility)
On-Chain Perspective:
- URPD accumulation cluster: $67,000-$69,000
- Recent capital deployment creates modest demand pocket
- This represents short-term stabilization zone, not structural support
Technical Perspective:
- Support zone from which BTC initially bounced
- Moderate demand visible on lower timeframes
- Losing $67k = breakdown acceleration
The Confluence: This is a reaction zone, not a structural floor. GEX warns that breaking $65k triggers dealer cascades. On-chain shows some accumulation $67-69k that could cause a temporary bounce. Technicals confirm this area has seen demand.
Trading Implication: Expect reactions here, but don't rely on it holding. If $65k breaks cleanly, price accelerates toward $62k Max Volatility level.
Zone 4: $60,000-$64,000 — The Critical Floor
GEX Perspective:
- Max Volatility (V) at $63,000
- Breakdown to V = dealer selling cascade and potential capitulation
- N1 ($65k) to V ($63k) is the "slide zone"
On-Chain Perspective:
- LTH cluster $60,000-$64,000 (already tested and reacted)
- Critical Warning: No significant LTH accumulation below $60k until $38k
- This is structural demand zone but support is weaker than ideal
Technical Perspective:
- Key structural support on weekly chart
- Holding here preserves the higher-low market structure
- Losing this zone likely confirms a local downtrend
The Confluence: All three layers agree — $63k is the line in the sand. GEX Max Volatility (V) at $63k aligns with the bottom of the LTH cluster.
Trading Implication: This is a make-or-break zone. Hold above = potential recovery structure. Break below = significant downside risk with next major support very far away.
Why Multi-Layer Analysis Matters
1. Higher Conviction Signals
When all three analytical layers align, you're not guessing — you're observing market structure from multiple dimensions. A resistance level that appears in:
- GEX dealer positioning, AND
- On-chain cost basis data, AND
- Technical chart structure
...is far more likely to hold than one appearing in a single framework.
2. Superior Risk Management
The multi-layer approach helps identify where NOT to be positioned:
- ❌ Don't long aggressively in negative gamma with bearish asymmetry
- ❌ Don't expect V-shaped reversals when realized losses spike
- ❌ Don't assume support will hold at GEX volatility triggers (N1, MV)
- ❌ Don't ignore breakeven cost basis zones where sellers wait
3. Regime Recognition
Each layer reveals different aspects of market state:
- GEX: Dealer behavior (stabilizing vs amplifying)
- On-Chain: Holder psychology (panic, accumulation, distribution)
- Technical: Trend regime (bullish, bearish, range)
Combining them provides a 3D map of market structure rather than a 2D view.
4. Reduced False Signals
Single-indicator analysis generates many false signals. Confluence filters noise:
- A technical support level might look strong but sits above on-chain cost basis (weak)
- A GEX magnet might appear important but lacks on-chain accumulation (temporary)
- An on-chain cluster might exist but faces negative gamma regime (unstable)
Multi-layer confluence eliminates low-quality setups.
Key Lessons from February 2026 Analysis
Our live case study revealed exceptional alignment:
| Zone | Price | Confluence | Signal Strength |
|---|---|---|---|
| Friction Zone | $70,000-$72,000 | GEX Flip + A2 Magnet + Technical friction | ⚠️ MILD FRICTION |
| Resistance Cluster | $73,000-$77,500 | GEX P1/P2/A1 + URPD supply + Technical resistance | 🔴 VERY STRONG |
| Reaction Zone | $65,000-$69,000 | GEX N1 + URPD accumulation + Technical support | ⚡ VOLATILE |
| Critical Floor | $60,000-$64,000 | GEX V + LTH cluster + Technical support | ⛔ MAKE-OR-BREAK |
Confluence Score: 4/5 — High confidence in these levels with strong alignment across Gamma Exposure, On-Chain data, and Technical structure.
Practical Application
When to Use This Framework
✅ Best for: - Major market turning points - High-conviction trade setups - Risk management decisions - Position sizing choices
❌ Not needed for: - Day trading noise - Very short-term scalping - When one signal is overwhelmingly clear
Workflow
- Start with GEX — Identify regime (positive/negative gamma) and key levels
- Layer On-Chain — Find cost basis, accumulation, and holder behavior zones
- Confirm with Technicals — Verify price structure and historical reactions
- Look for Confluence — Mark zones where 2+ layers align
- Trade the Strongest Signals — Focus on zones with 3-layer agreement
Conclusion: The Power of Convergence
The February 2026 Bitcoin analysis demonstrates that multi-dimensional market analysis isn't about using more indicators — it's about combining different types of truth.
Each analytical layer sees the market through a unique lens: - GEX sees the dealer's hand - On-Chain sees the capital's footprint - Technicals see the price's memory
When these three perspectives point to the same levels, you're not just trading a chart pattern or a single metric. You're reading the market's actual architecture.
The confluence zones we identified at $72k, $73-77.5k, $65k, and $60-64k weren't arbitrary — they represented real structural forces from dealer hedging, capital deployment, and price discovery all converging at the same levels.
This is the difference between trading with conviction and trading with hope.
About the Authors
Victor Founder of GammaFlip.io, providing real-time gamma exposure analytics from Deribit and Bybit. Background in quantitative finance, AI, and derivatives trading.
Parsa On-chain and technical analyst specializing in UTXO-based metrics, holder behavior analysis, and market structure identification.
Want to explore GEX analysis yourself? Visit GammaFlip.io for real-time gamma exposure data.
For on-chain and technical analysis, follow Parsa's research in the GammaFlip Community.
Info
Post-Expiration Note: We will publish a follow-up "Notes" article after the February 13th expiration to analyze how these zones performed in reality. This "Forecast vs. Reality" review is key to refining the conviction of our multi-layer framework.
Disclaimer: This article is for educational purposes only. Not financial advice. Always do your own research and manage risk appropriately.
Ready to see GEX in action?
Try GammaFlip.io and experience professional-grade gamma exposure analysis
Launch App