Reach Probability: The Odds Price Closes Above or Below Each GEX Level
Every marker on GEX by Strike answers where. The Flip sits at $71,476. A magnet at $72,000. A gamma wall at $80,000. Useful — but it leaves the most important question hanging:
What are the odds price ends above (or below) it — by a date you choose?
A wall at $80,000 means one thing if there's a 40% chance price closes above it this week and something completely different if there's a 1% chance. Reach Probability answers that question for every marker at once, and stamps the answer right on the chart.
One thing to be precise about up front: despite the name, this isn't a touch probability. It doesn't ask whether price grazes a level intraday and snaps back — it asks where price ends up at the horizon. The number on each marker is the share of simulated paths that finish at or above (or at or below) that level. "Reach %" is the friendly label; "terminal probability" is what's under it.
What it computes
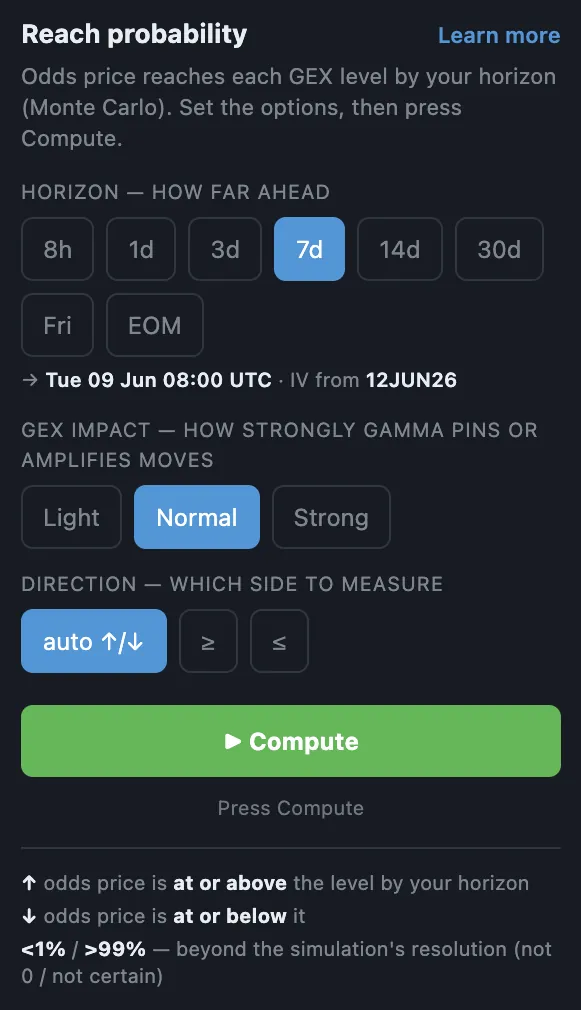
Open it with the 🎯 Reach % button in the nav bar, next to the view toggles. Set three options, press Compute, and every GEX level picks up a heat-colored % chip — warm for likely, cool for a long shot.
Under the hood it's the same engine as the Monte Carlo Simulator: 20,000 price paths seeded with the current ATM implied volatility and bent by the live GEX surface — positive-gamma zones gently compress moves, negative-gamma zones amplify them. Reach Probability just asks that cloud of paths a different question for every marker: how many of you finish on the far side of this line at the deadline?
The three controls
- Horizon — how far ahead. The deadline the odds are measured to: 8h, 1d, 3d, 7d, 14d, 30d, this Friday's expiry, or end-of-month. The line under the buttons spells out the exact UTC target time and which expiration's IV seeds the walk, so there's no guessing what "7d" resolved to.
- GEX Impact — how strongly gamma pins or amplifies moves. Light is almost a plain lognormal walk — the GEX walls barely deflect paths. Normal is the calibrated default; use it 90% of the time. Strong pulls paths hard toward the walls and tightens the distribution — a stress test, not a base case.
- Direction — which side to measure. Leave it on auto ↑/↓ and the app reads each marker from the natural side (more on that below). Force ≥ to read "ends at or above" for every level, or ≤ for "at or below."
Reading the chips
This is the part worth slowing down on. Each chip carries an arrow and a number:
- ↑ N% — the odds price is at or above that level by your horizon.
- ↓ N% — the odds price is at or below it.
- <1% / >99% — the level is past the simulation's resolution. Read it as "vanishingly unlikely" or "all but certain" — not a hard 0% or 100%.
In auto mode the arrow flips around spot: a level above price reads ↑ (the chance of closing at or above it), and a level below price reads ↓ (the chance of closing at or below it). That's almost always the question you actually care about — "do we finish above that wall?" or "do we finish under that support?"
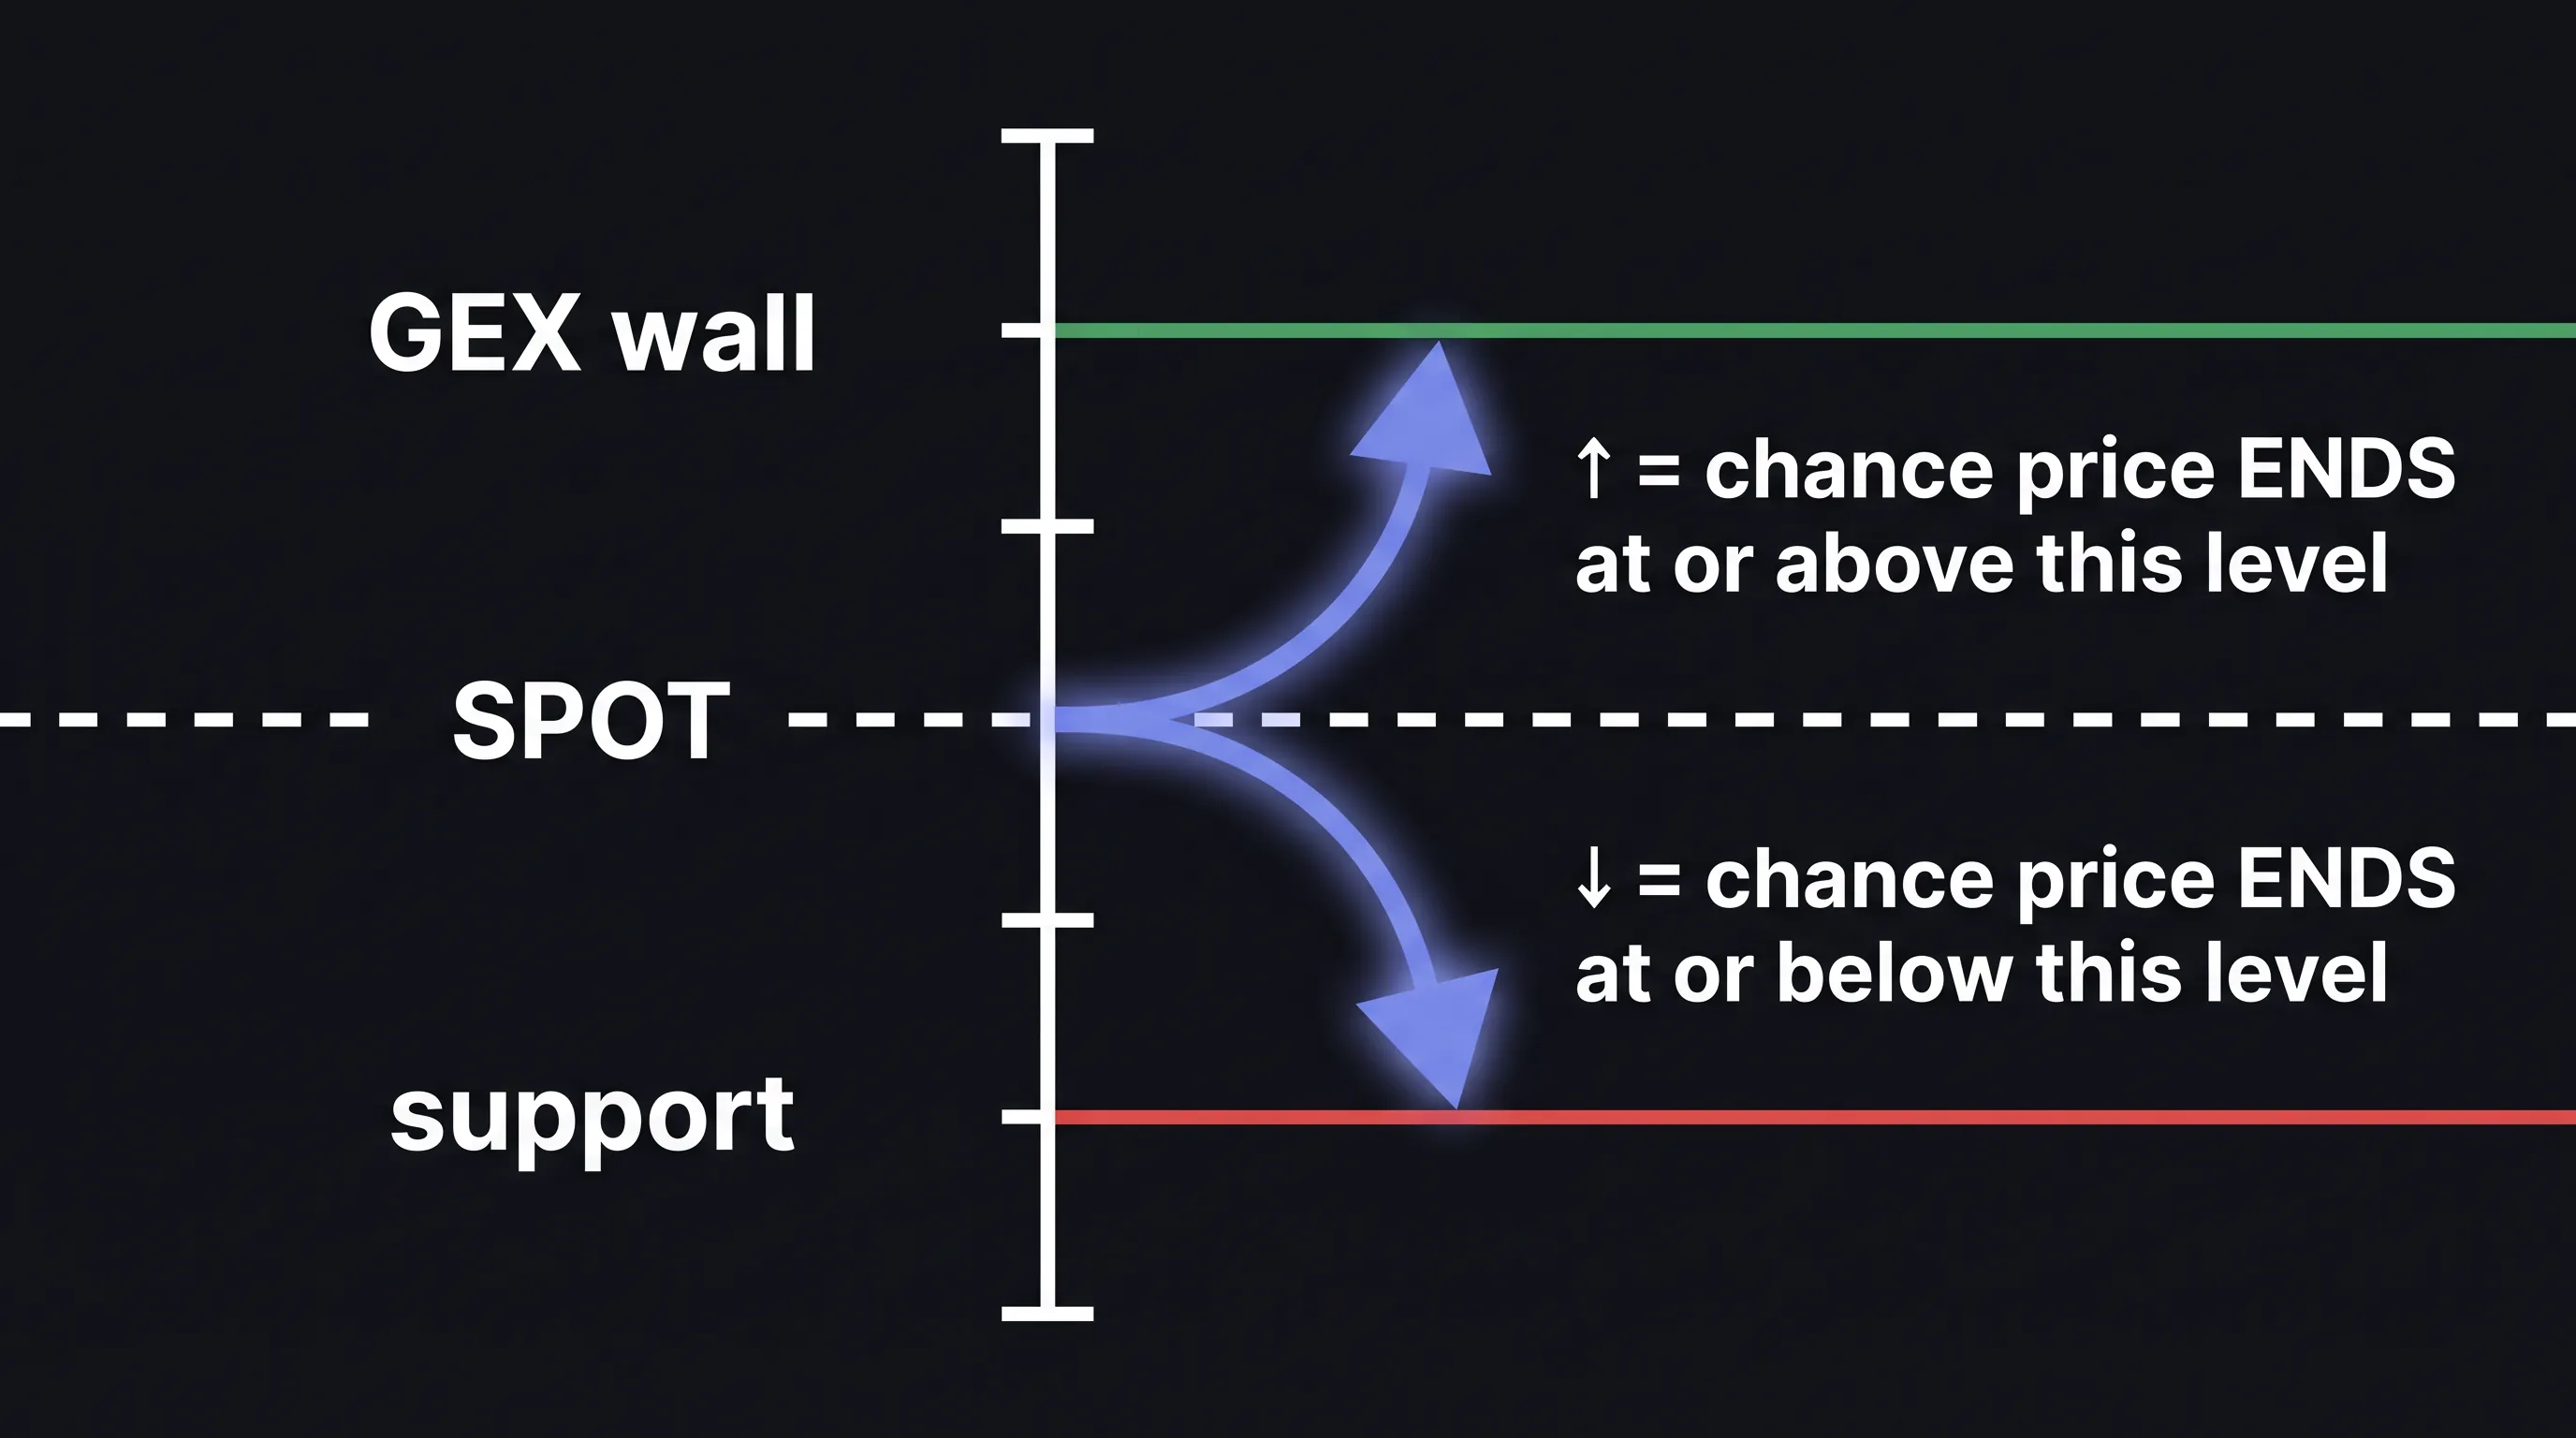 Auto direction in one picture. For a level above spot the chip reads ↑ — the odds price ends at or above it; for a level below, ↓ — the odds it ends at or below it. It's about where price finishes, not whether it grazes the line on the way.
On the chart, the chips ride directly on the marker badges:
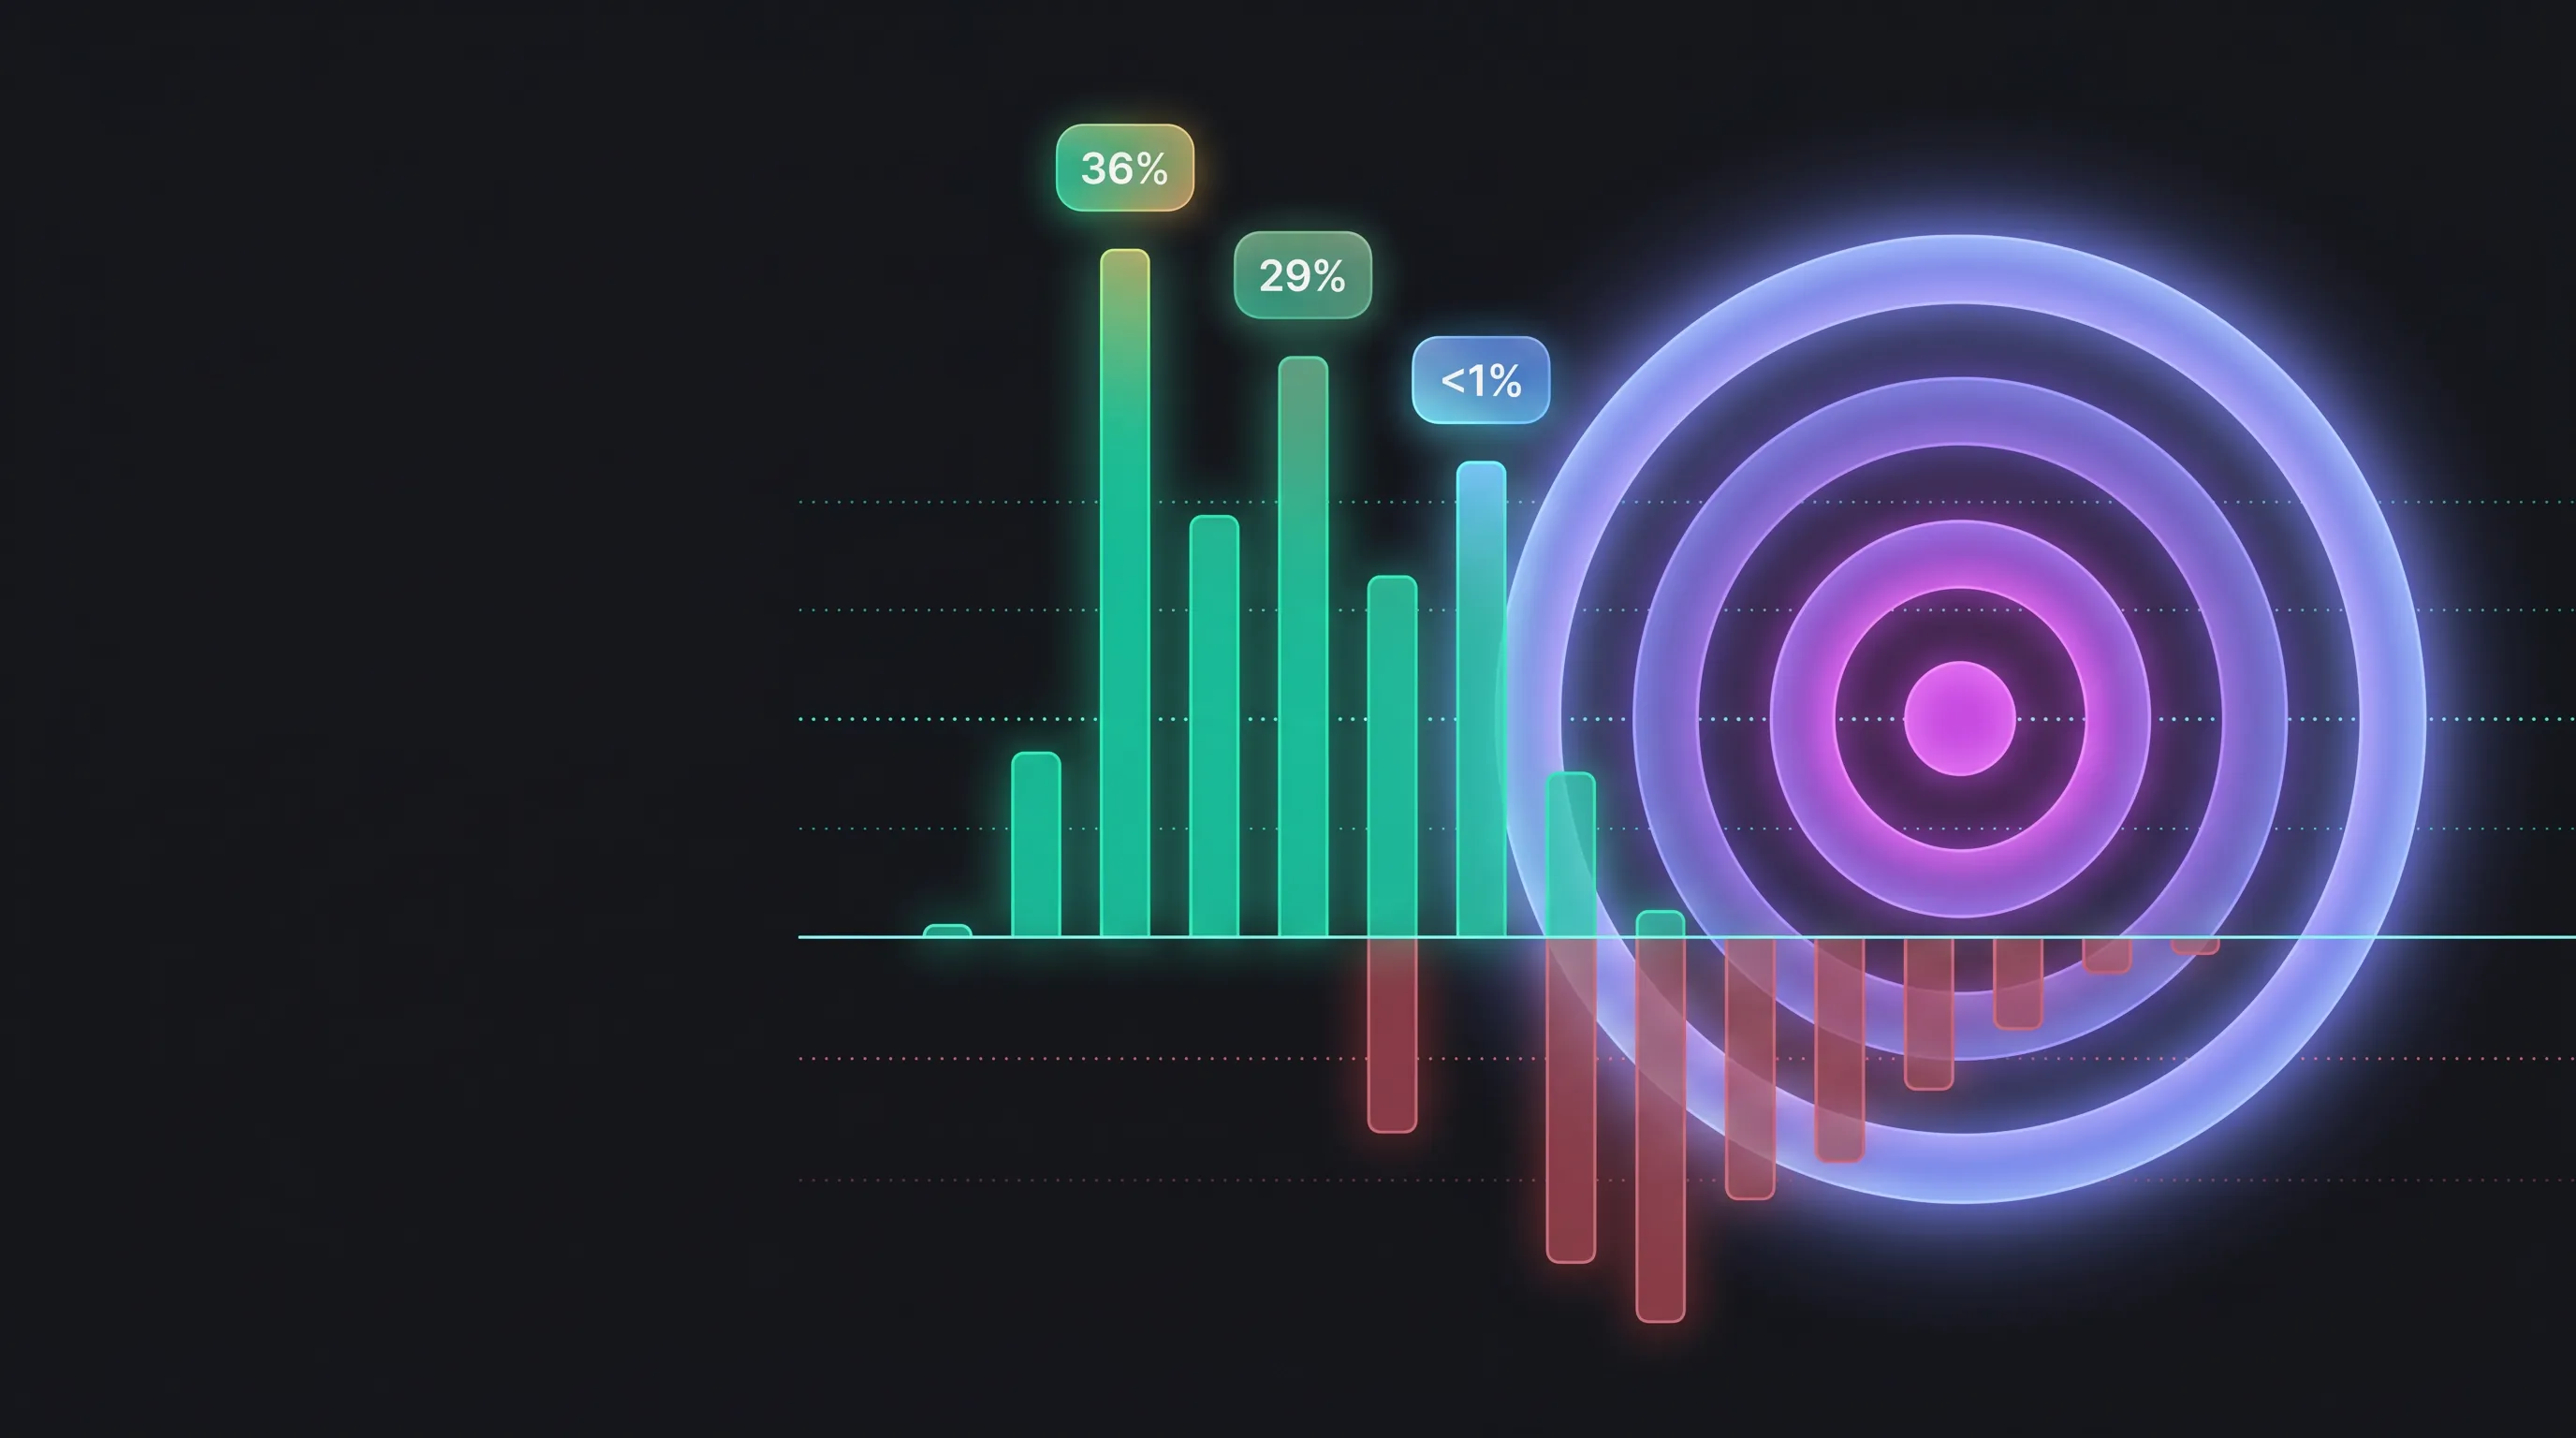
 Read it like a sentence. The Flip at $71,476 carries a 36% chance of price closing at or above it this week (F · ↑36%); the next magnet up, a 31% chance (A2 · ↑31%). The $80k+ gamma walls are <1% — at this horizon a close beyond them is off the table. Downside, the $68k vol trigger is a realistic 29% to close below (N2 · ↓29%).
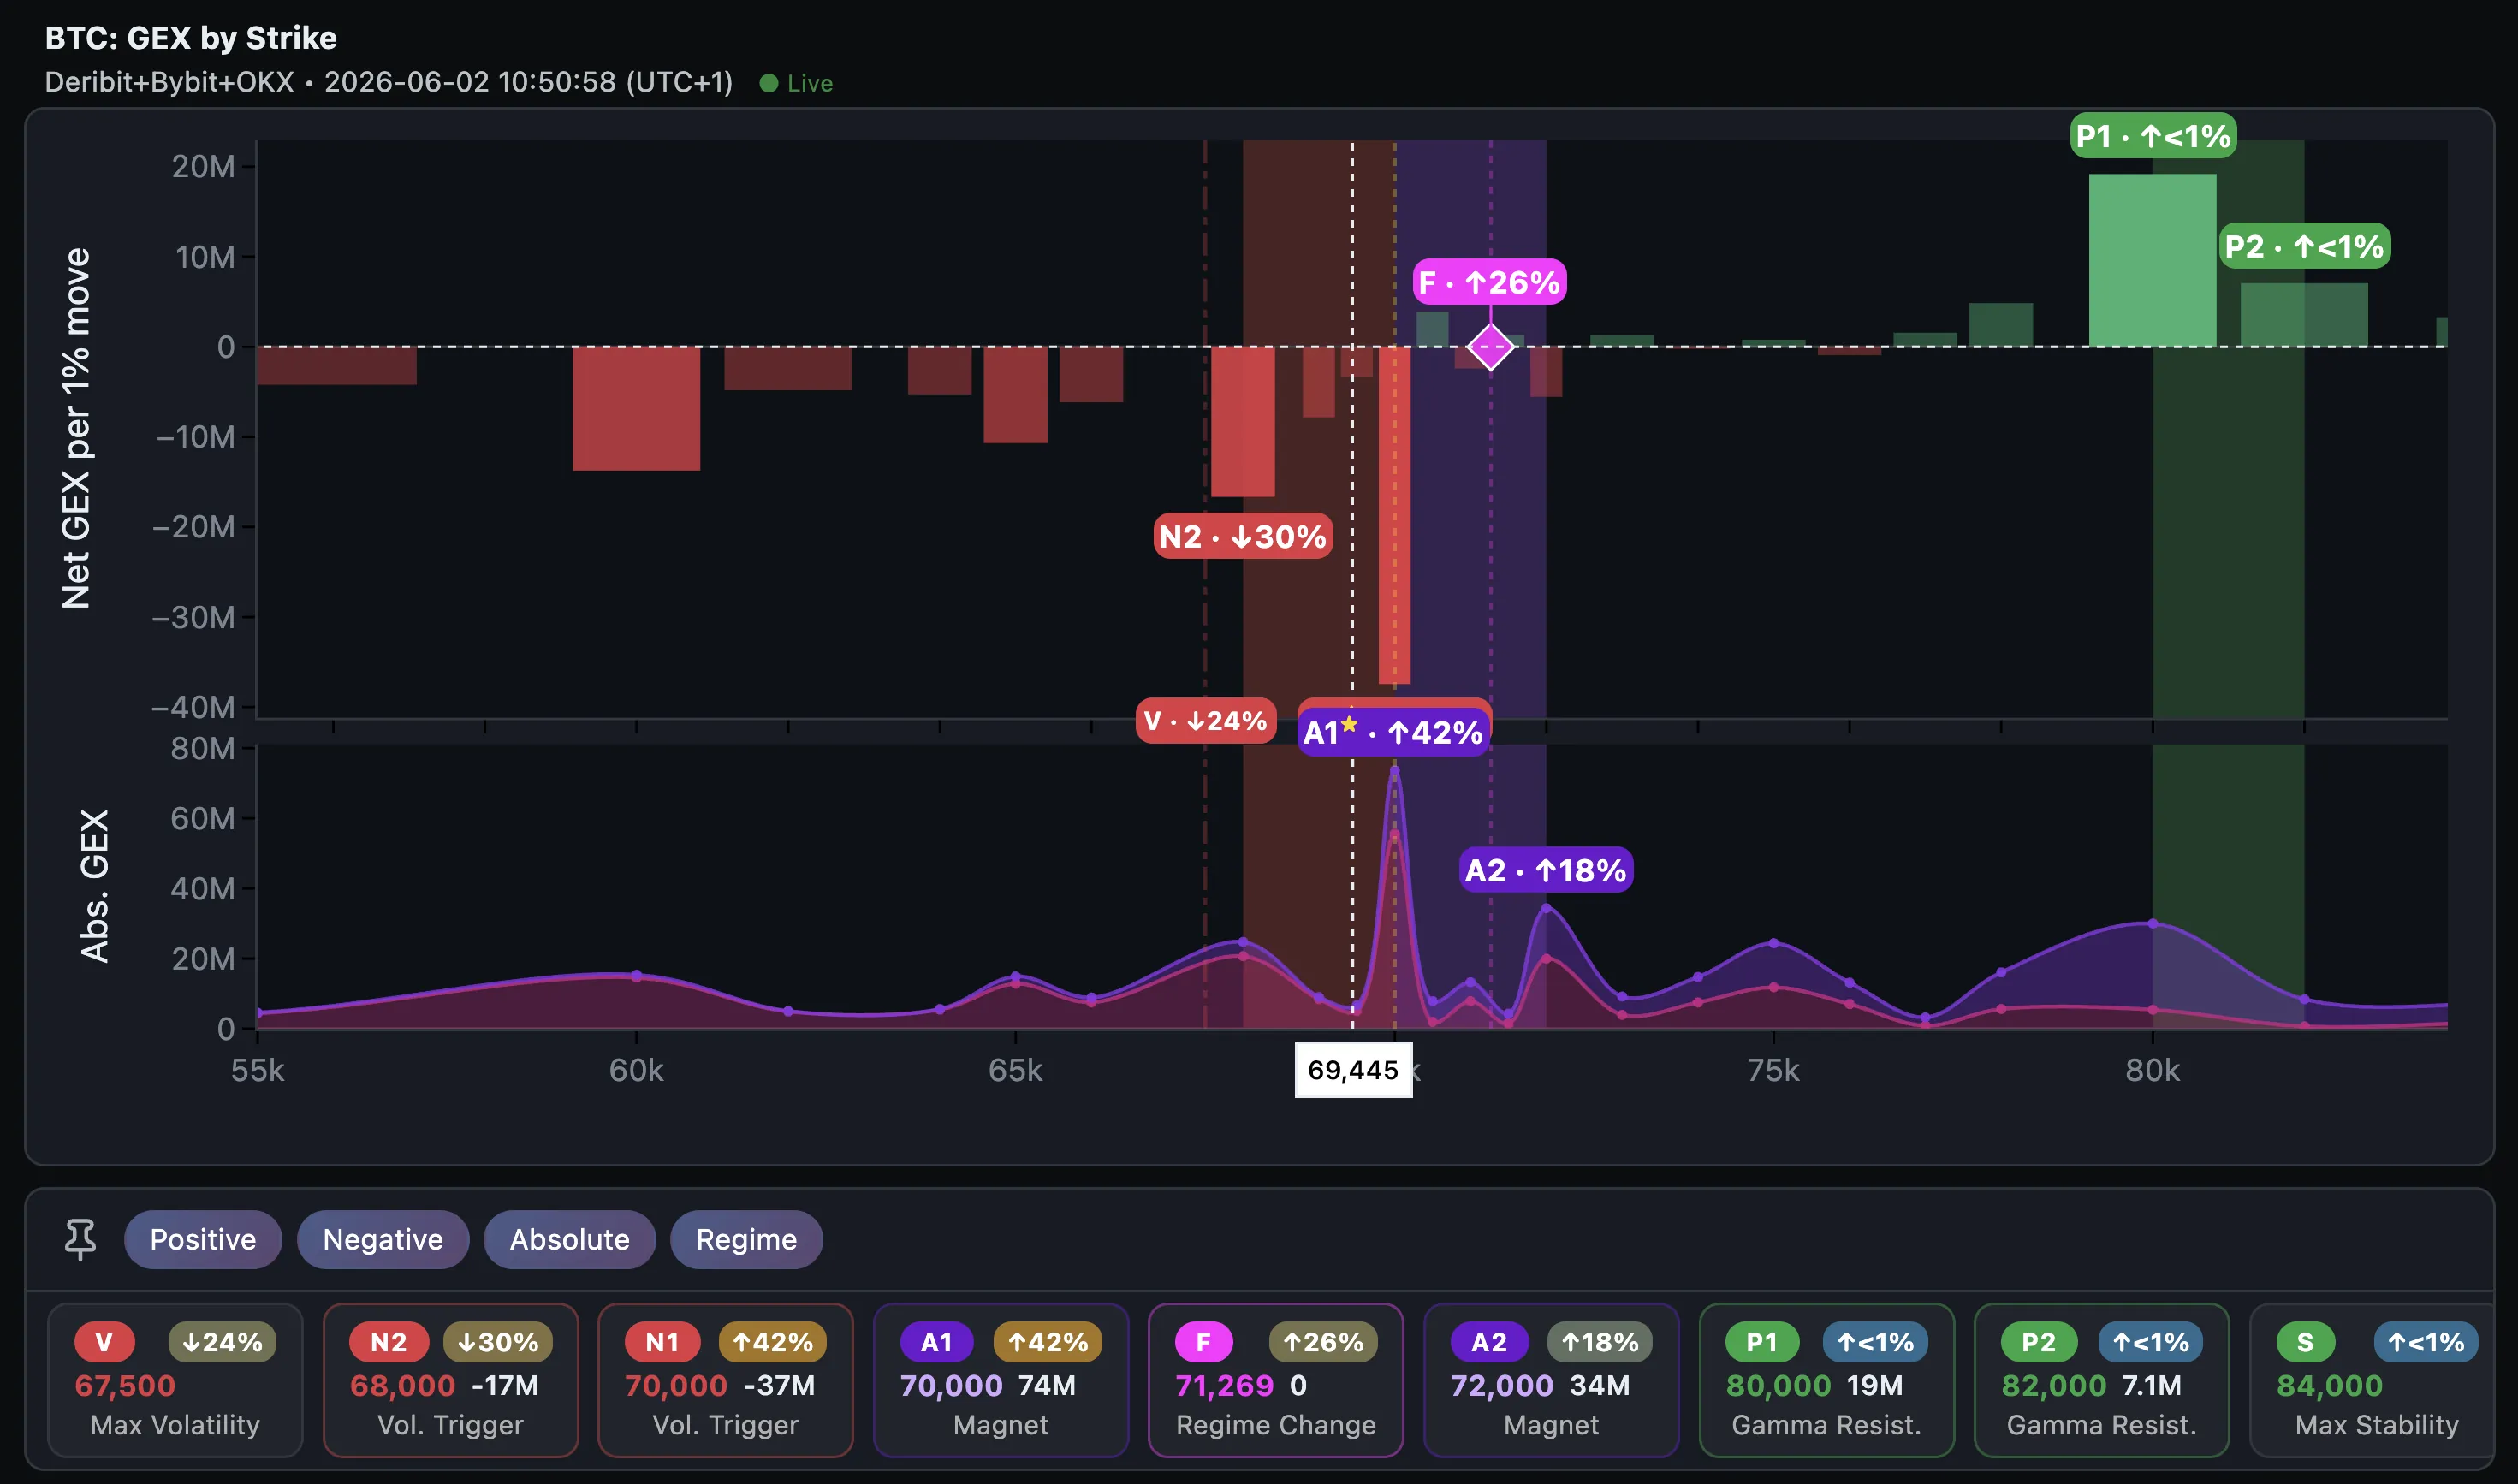
The same chips appear on the marker cards under the chart, so you get the odds without reading the plot:
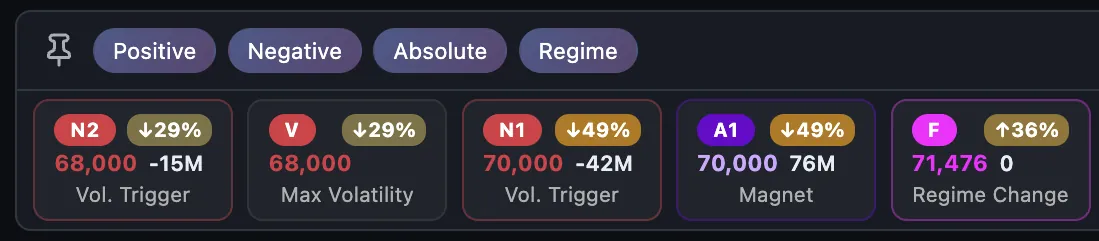 Every level, its role, its size, and now its odds — in one row.
Using it in a trade plan
The chips turn the marker map into a quick filter:
- A nearby wall with a high Reach % is in play. If the next A-line up is 31% to close above this week, targeting a move into it is a live idea.
- A far wall at <5% isn't a level you're trading — it's a tail. If your thesis needs price to close beyond a marker the chips put at 1%, you're not fading the wall, you're betting on the cone.
- The Flip chip is the regime read. "36% chance of closing at or above the Flip" is a direct probability of finishing your horizon in the positive-gamma regime — one of the highest-information numbers on the page.
- Shorten the horizon to pressure-test. A level that's 30% at 7d but 4% at 1d tells you the move is possible but not imminent.
Pair it with the Flip Point context: once price is in positive-gamma territory, Strong-impact odds tighten fast, and the difference between Normal and Strong tells you how much of the forecast is leaning on the gamma assumption versus raw IV.
The same limits as Monte Carlo
Reach Probability inherits every caveat of the engine behind it. Inputs are a snapshot now — the model doesn't know CPI prints at 8:30 or that positioning will shift this afternoon. The cone widens with time, so short horizons are far more trustworthy than 30-day reads. And tail odds (the <1% / >99% chips) are model-dependent — treat them as "off the table," not as precise quotes.
Used inside those limits, it does one thing very well: it stops you from treating every marker as an equally likely close. Some walls are this week's battleground. Most aren't. The chips tell you which is which — at a glance, before you've placed a single order.
Ready to see GEX in action?
Try GammaFlip.io and experience professional-grade gamma exposure analysis
Open Dashboard