
Which Expiration Built This Wall?
Every gamma wall on the TOTAL view is a stack of expirations. Now you can click it open and see the stack — and predict what happens to the wall when the top of it settles.
A trader emails in:
"There's a hard N1 level at $60K — the kind of spot where moves can accelerate. I'm positioning around it. But it's mid-week; does this level survive Friday's settlement, or is it about to evaporate before it matters?"
Until now, the honest answer was "switch to each expiration and add it up in your head." The new per-expiration breakdown answers it in one click.
What It Does
On the GEX by Strike chart, the key levels — N1/N2 (the strongest put-side / negative-net walls), P1/P2 (the strongest call-side / positive-net walls), and A1/A2 (the largest by absolute magnitude) — are each a sum across every expiration on the book in TOTAL mode.
Click one, and a donut breaks that sum into the expirations that build it: the top contributors named individually, everything small folded into Other. You see, at a glance, whether the wall is one heavy expiration or a broad consensus across the curve.
It only appears in TOTAL mode — a single expiration has nothing to decompose.
Reading the Net Donut (N1/N2/P1/P2)
For the net walls, each slice is one expiration's Net GEX at that strike — calls minus puts. The hue tells you direction: red = put-heavy (pushing the net negative), green = call-heavy (pushing it positive). Shades within a colour separate the slices so you can actually see the split.
One thing the colours don't say — what the level actually does — changes how you use it. A positive-net wall (P) is a stabilizer: dealer hedging there leans against moves, so it behaves like a pin — soft support or resistance. A negative-net wall (N) is the opposite: a volatility trigger, where hedging amplifies a move, so price tends to accelerate around it rather than stall. So the $60K N1 below isn't a floor holding price up — it's a level where, if price arrives, things are likely to get faster. The breakdown reads the same for both; it just tells you which expirations power that behaviour, and for how long.
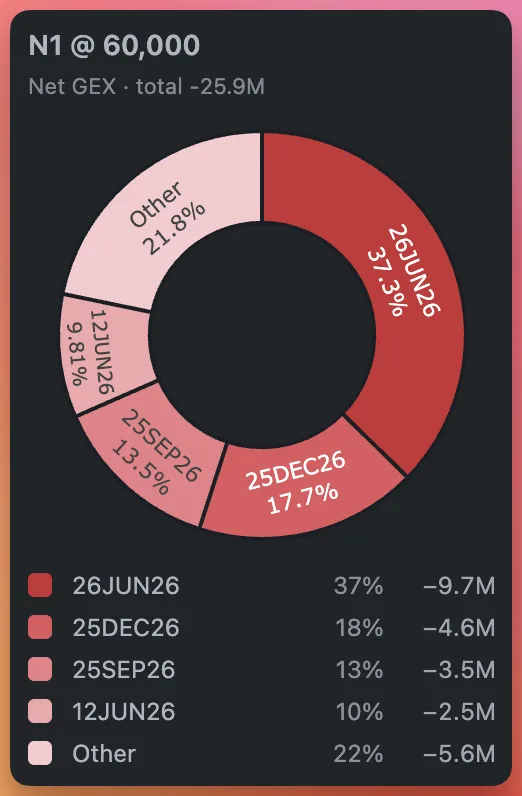
This N1 wall at $60K is −25.9M of net gamma, and one expiration — the 26JUN26 quarterly, ~18 days out as of this June 8 snapshot — supplies 37% of it (−9.7M). The rest sits in the 25DEC26 and 25SEP26 quarterlies and a single near-term weekly (12JUN26, ~10%), with everything below the cutoff pooled into Other.
That breakdown reframes the trade — but only if you read the dates, not just the sizes. More than two-thirds of this wall is quarterly tenors (June, September, December); barely a tenth is this Friday's weekly. This is a durable, structural volatility trigger — an acceleration zone that persists for weeks, not something that rolls off at the next settlement.
Reading the Absolute Donut (A1/A2)
The A-markers rank strikes by total gamma magnitude (calls plus puts), so their breakdown uses the absolute metric: every slice positive, shaded on a purple ramp by size (matching the A1/A2 marker colour). This is the "how much hedging pressure sits here, regardless of direction" view.
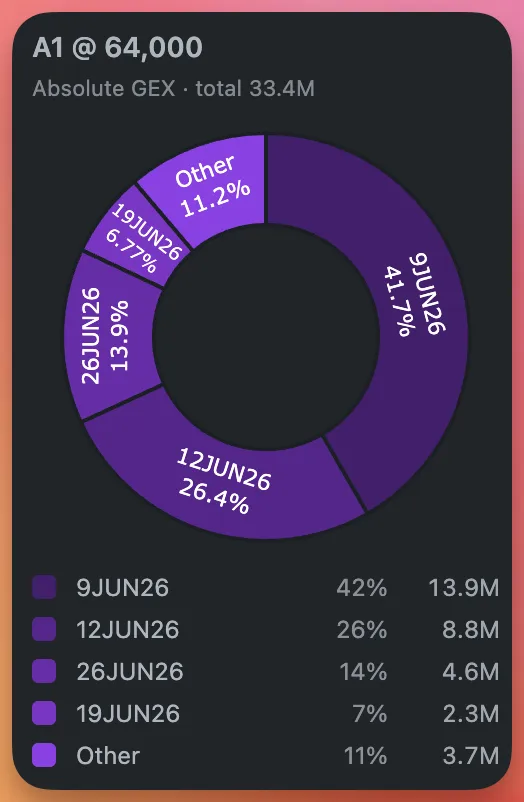
Now a different level — and the opposite story. The strongest absolute magnet sits at $64K, 33.4M of gamma, and 42% of it is 9JUN26 — tomorrow's daily — with another 26% in this Friday's 12JUN26 weekly. That's roughly two-thirds of the magnet expiring within four days: a tactical level whose pull mostly evaporates almost immediately, not a structural one. The donut shape resembles the $60K wall; only the dates on the slices reveal these are completely different animals.
Why This Is a Forecast, Not Just a Label
Here's the part that matters for positioning.
A wall is only as durable as the expirations holding it up. When a contributing expiration settles, its slice leaves the marker. So the breakdown isn't just describing the wall today — it's telling you what the wall becomes after each upcoming settlement.
Take the $60K N1 first. Two settlements are coming, and the donut tells you which one matters. 12JUN26 — this Friday's weekly — is only ~10% of it; when it settles, the level barely moves. The big one is the 26JUN26 quarterly at ~37%, ~18 days out. When it expires at 08:00 UTC on June 26:
- That ~37% comes out of the strike.
- The N1 net shrinks from −25.9M toward roughly −16M, all else equal.
- The level either drops down the rankings or holds — depending on whether the remaining expirations (the September and December quarterlies) still out-stack the competition.
So the $60K trigger does not evaporate at Friday's settlement; only its ~10% weekly slice does. It's a durable acceleration zone anchored by quarterlies — the date that actually matters is June 26, not this week.
Now the $64K A1 magnet, for contrast. It's 42% 9JUN26 — tomorrow's daily — plus 26% in this Friday's weekly: two-thirds of it gone within four days. At tomorrow's 08:00 UTC settlement it sheds ~42% of its mass overnight. Same donut shape, same app, opposite lifespan — a here-today level, gutted before the $60K trigger has even started to weaken. The only thing that told them apart was the dates on the slices.
Slice size tells you how much a level is one expiration; the slice's date tells you when that matters. 42% in tomorrow's expiry is gone tomorrow; a third in a quarterly lasts weeks. The donut shows you both at once.
Net vs Absolute: Which Slice Matters
- Reading a level's character (does it stabilize or accelerate — and which way does each expiration pull?) → the net donut on N/P. The sign colours show whether each expiration adds call-side stabilization or put-side acceleration; a lone green slice inside a red N-wall is one expiration quietly working against the trigger.
- Sizing pin risk / magnet strength (how much hedging is anchored here?) → read the absolute donut on A. Direction-agnostic, it's the raw concentration of gamma at the strike.
Slices under 5% of a strike's total fold into Other by design — the donut shows you what moves the wall, not a dozen negligible slivers.
Two Ways to Open It
From the markers widget. Any marker that has a breakdown carries a small pie-chart icon on its badge. Tap it and the donut opens anchored to the badge.
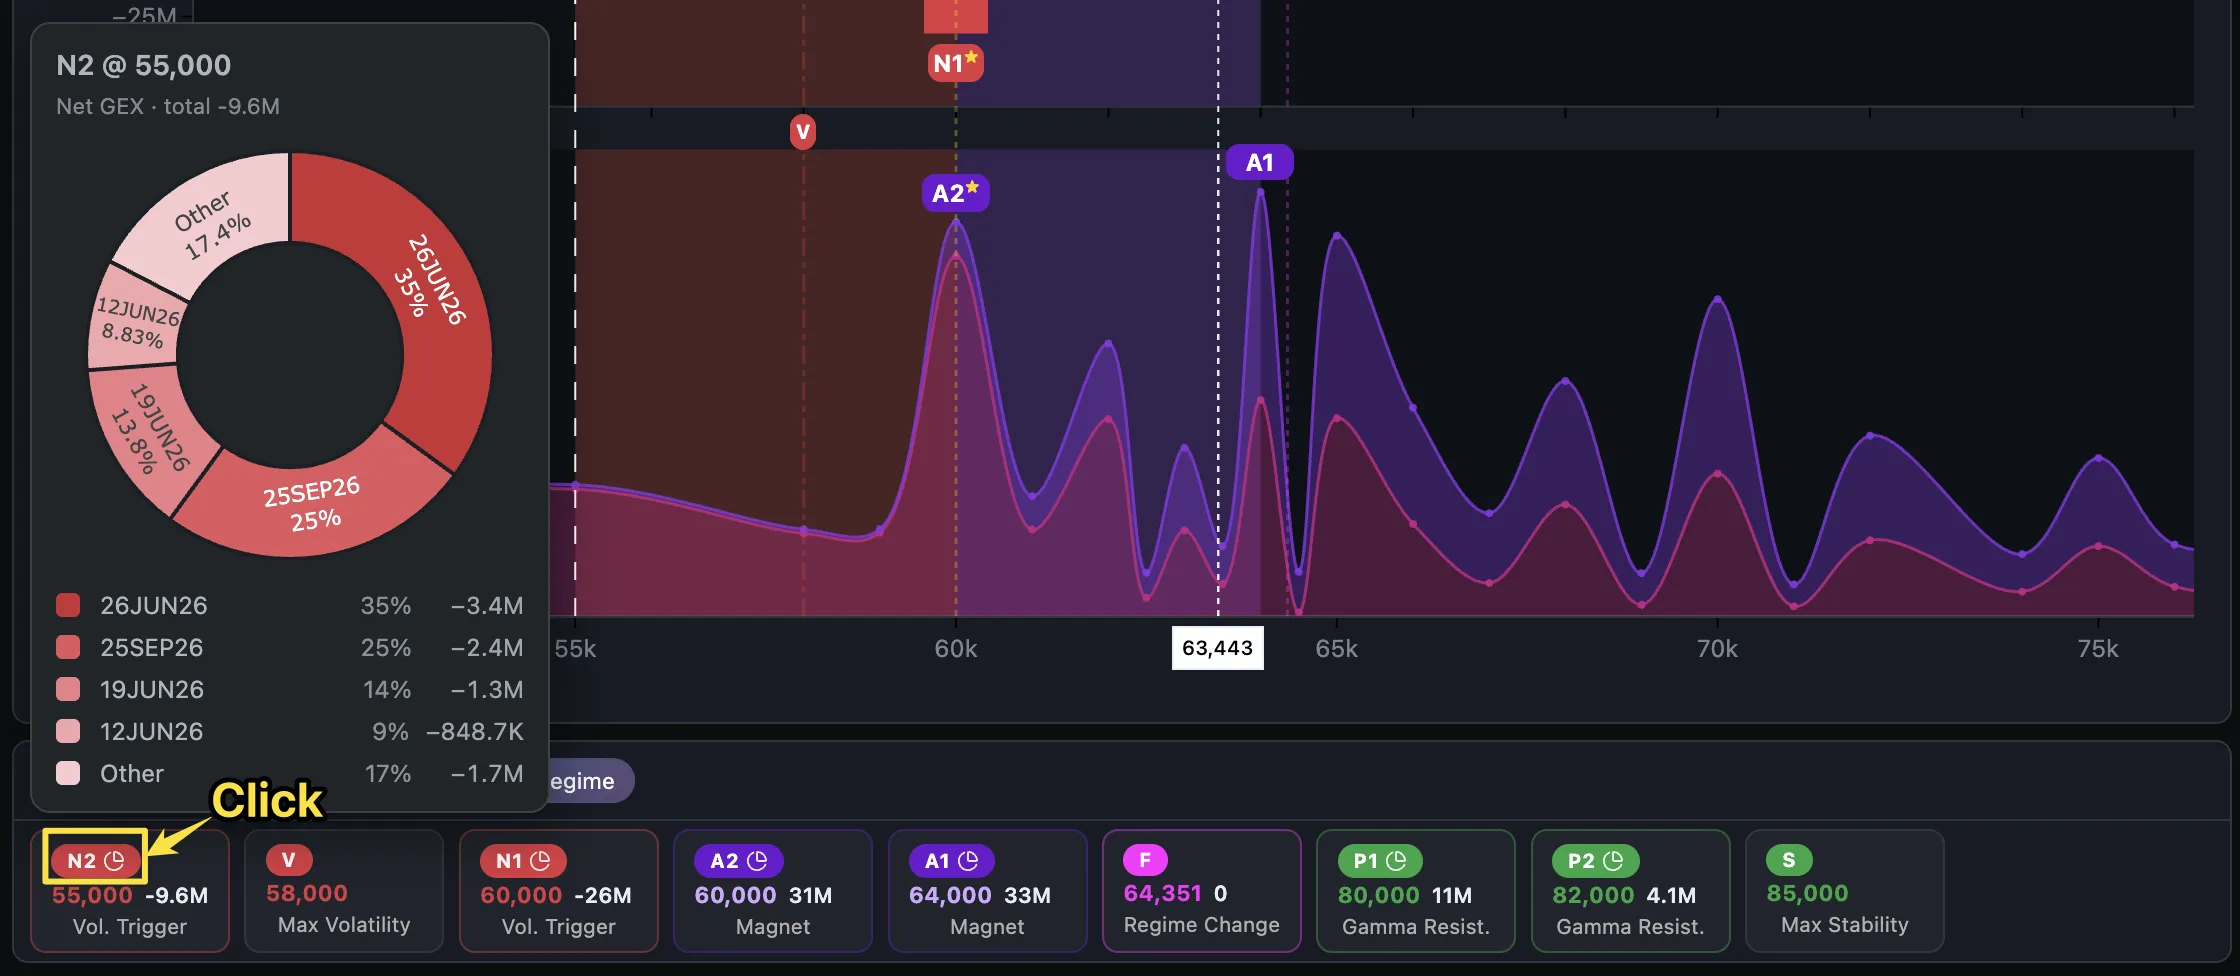
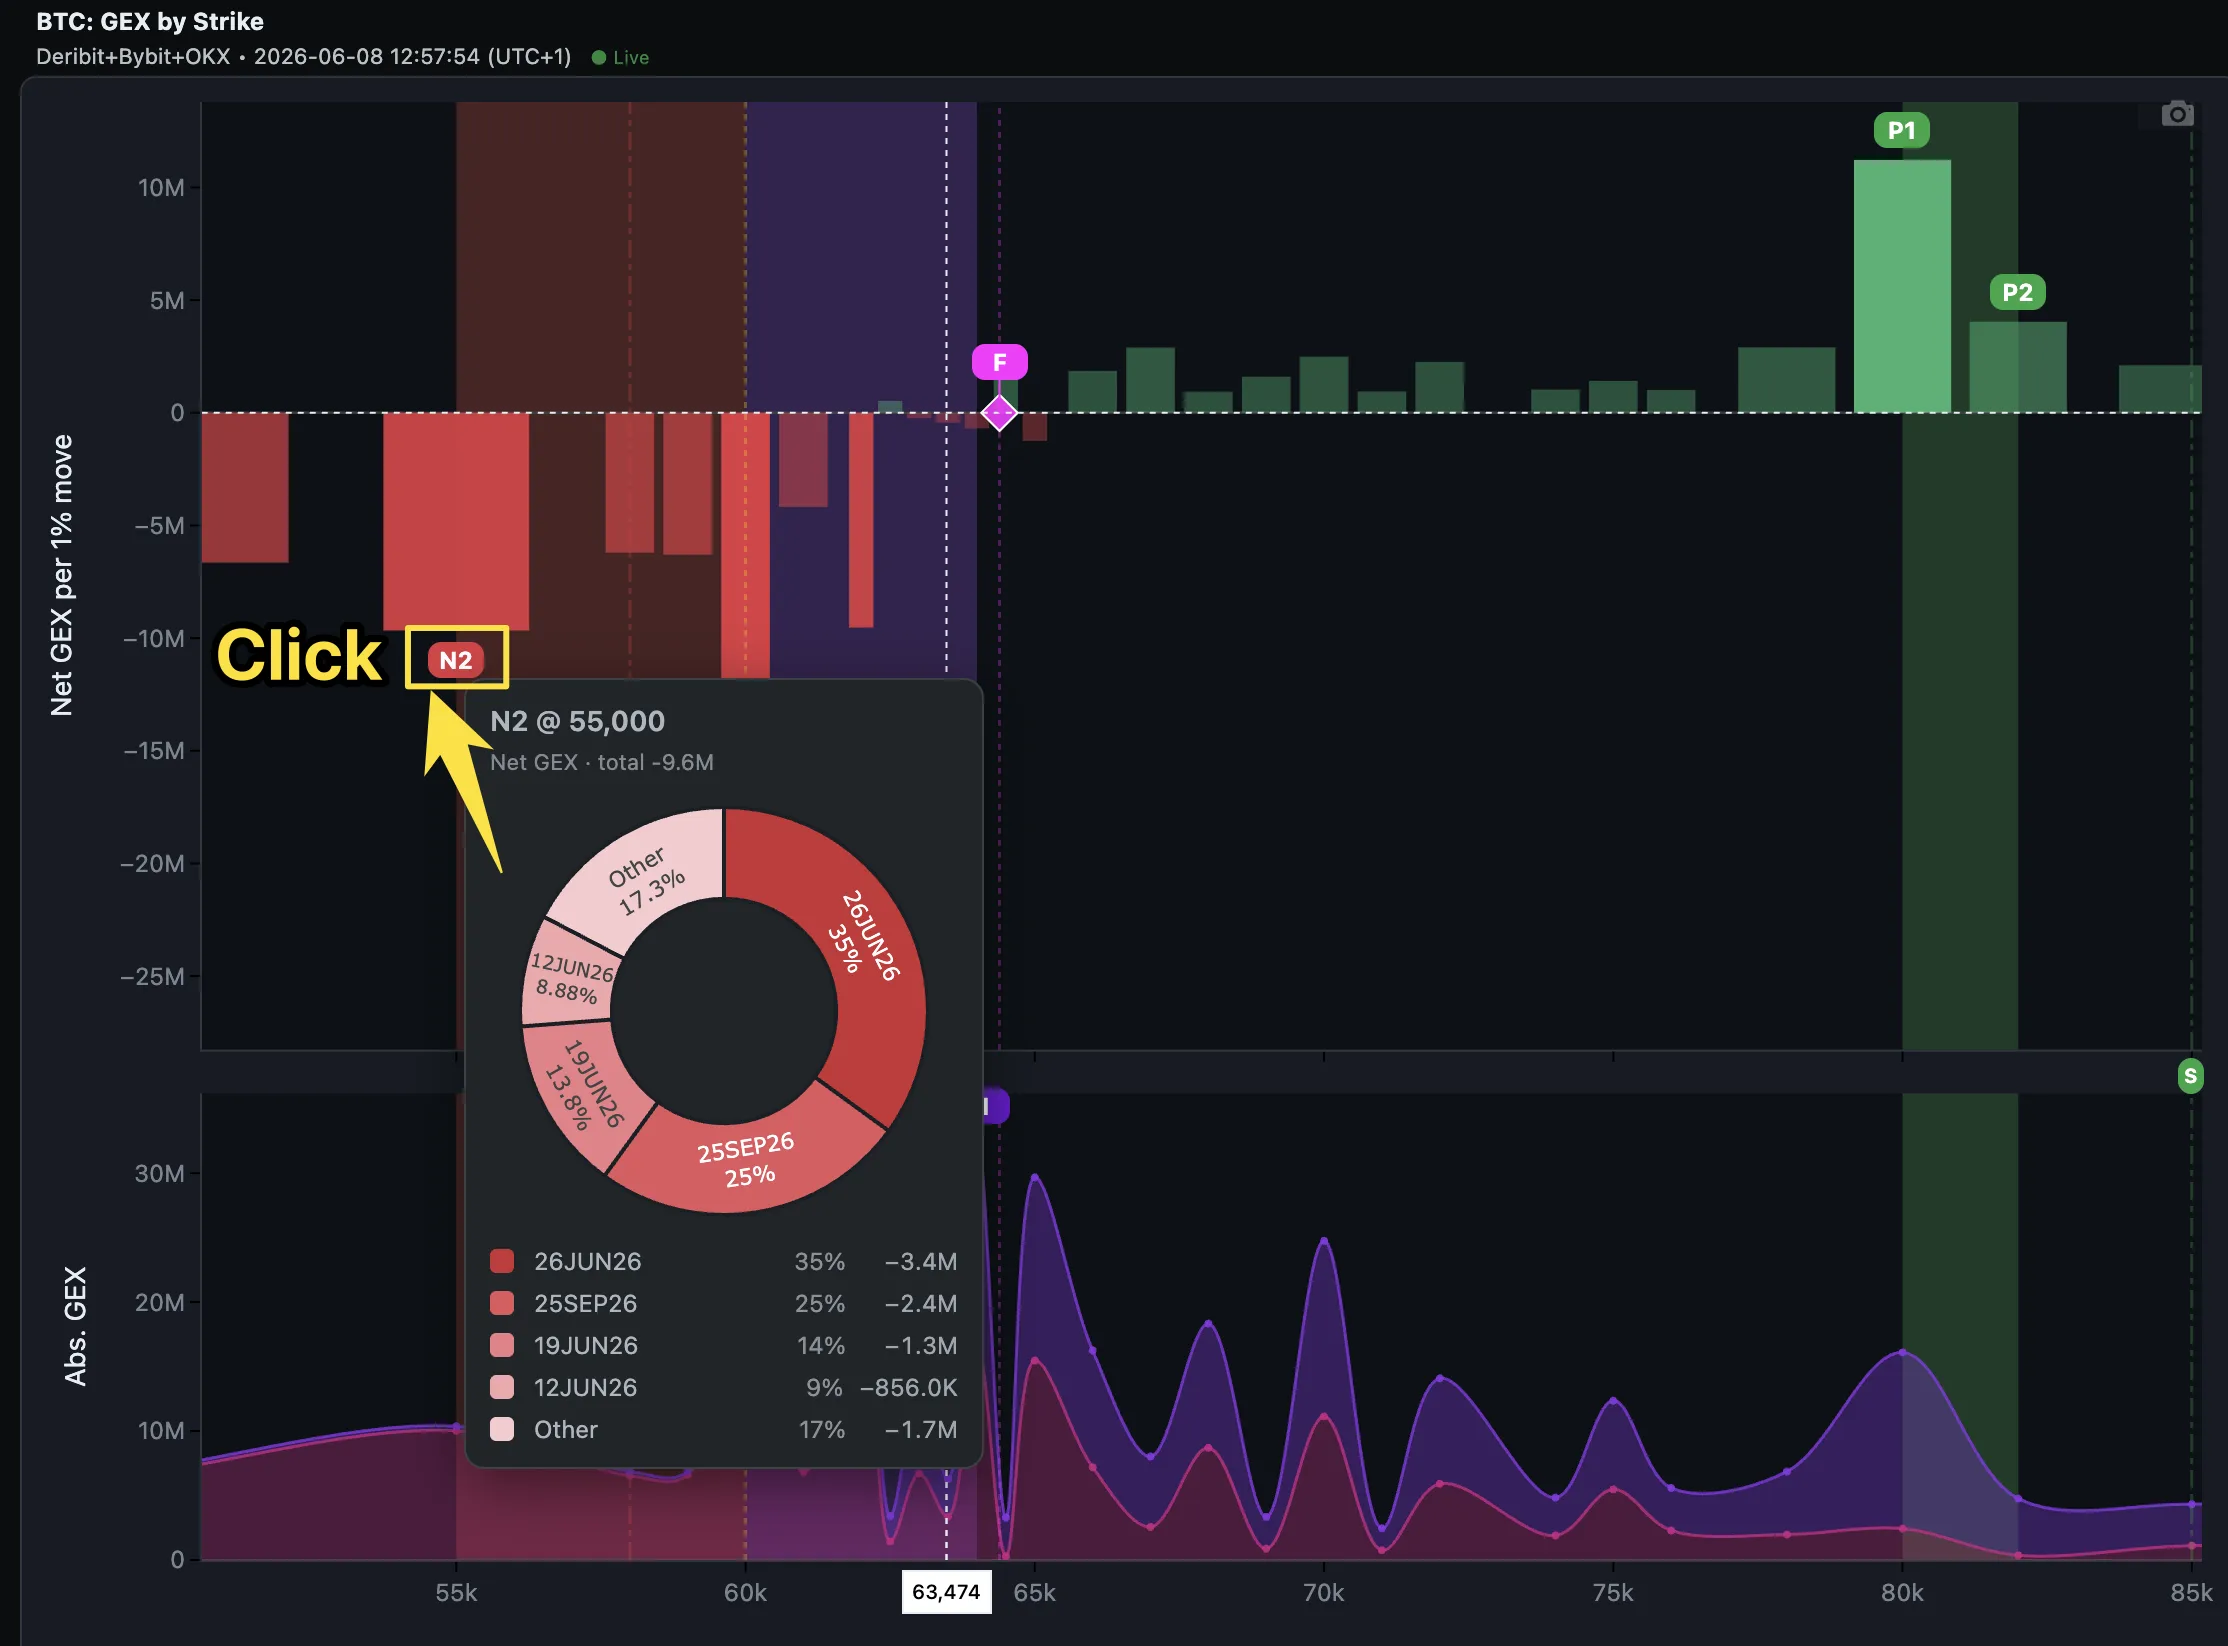
From the chart. Click the N1/A1/P1… label directly on the GEX by Strike chart. Same donut, anchored at the click. On a phone both open as a bottom sheet.
How It Fits the Rest of the App
This is the per-level companion to Term-GEX ABS. Term-GEX ABS answers "which expiration is driving the whole book?" — one bar per expiration across all strikes. The breakdown donut zooms that question down to a single wall: "which expiration is driving this level?"
Use them together. Term-GEX ABS tells you the dominant expiration overall; the donut confirms whether that same expiration is what's holding the specific strike you're about to trade. And once you know a wall is concentrated in a near-term book, the TOTAL vs Specific Date logic tells you exactly which expiration to switch to for the tactical view.
New to the concepts? Start with What Is Gamma Exposure.
Key Takeaways
- Every TOTAL wall is a stack of expirations. Click N1/N2/P1/P2 (net) or A1/A2 (absolute) to see the stack as a donut — top contributors named, the rest in Other.
- The breakdown is a forecast. When a contributing expiration settles, its slice leaves the marker — so read the dates: a third in this Friday's weekly has a half-life of days; a third in a quarterly is durable for weeks.
- Tenor is the read, not just size. A dominant near-term expiration → tactical level with a short fuse. A dominant quarterly, or a spread across many tenors → structural level you can size for cycles.
A gamma wall isn't a fixed object — it's a sum with an expiration schedule. Now you can see the schedule.
Info
Disclaimer: This article is for educational purposes only. GEX metrics describe market structure — they are not price predictions. Past patterns do not guarantee future results. Always use proper risk management and consider multiple data sources before making trading decisions.
Ready to see GEX in action?
Try GammaFlip.io and experience professional-grade gamma exposure analysis
Open Dashboard