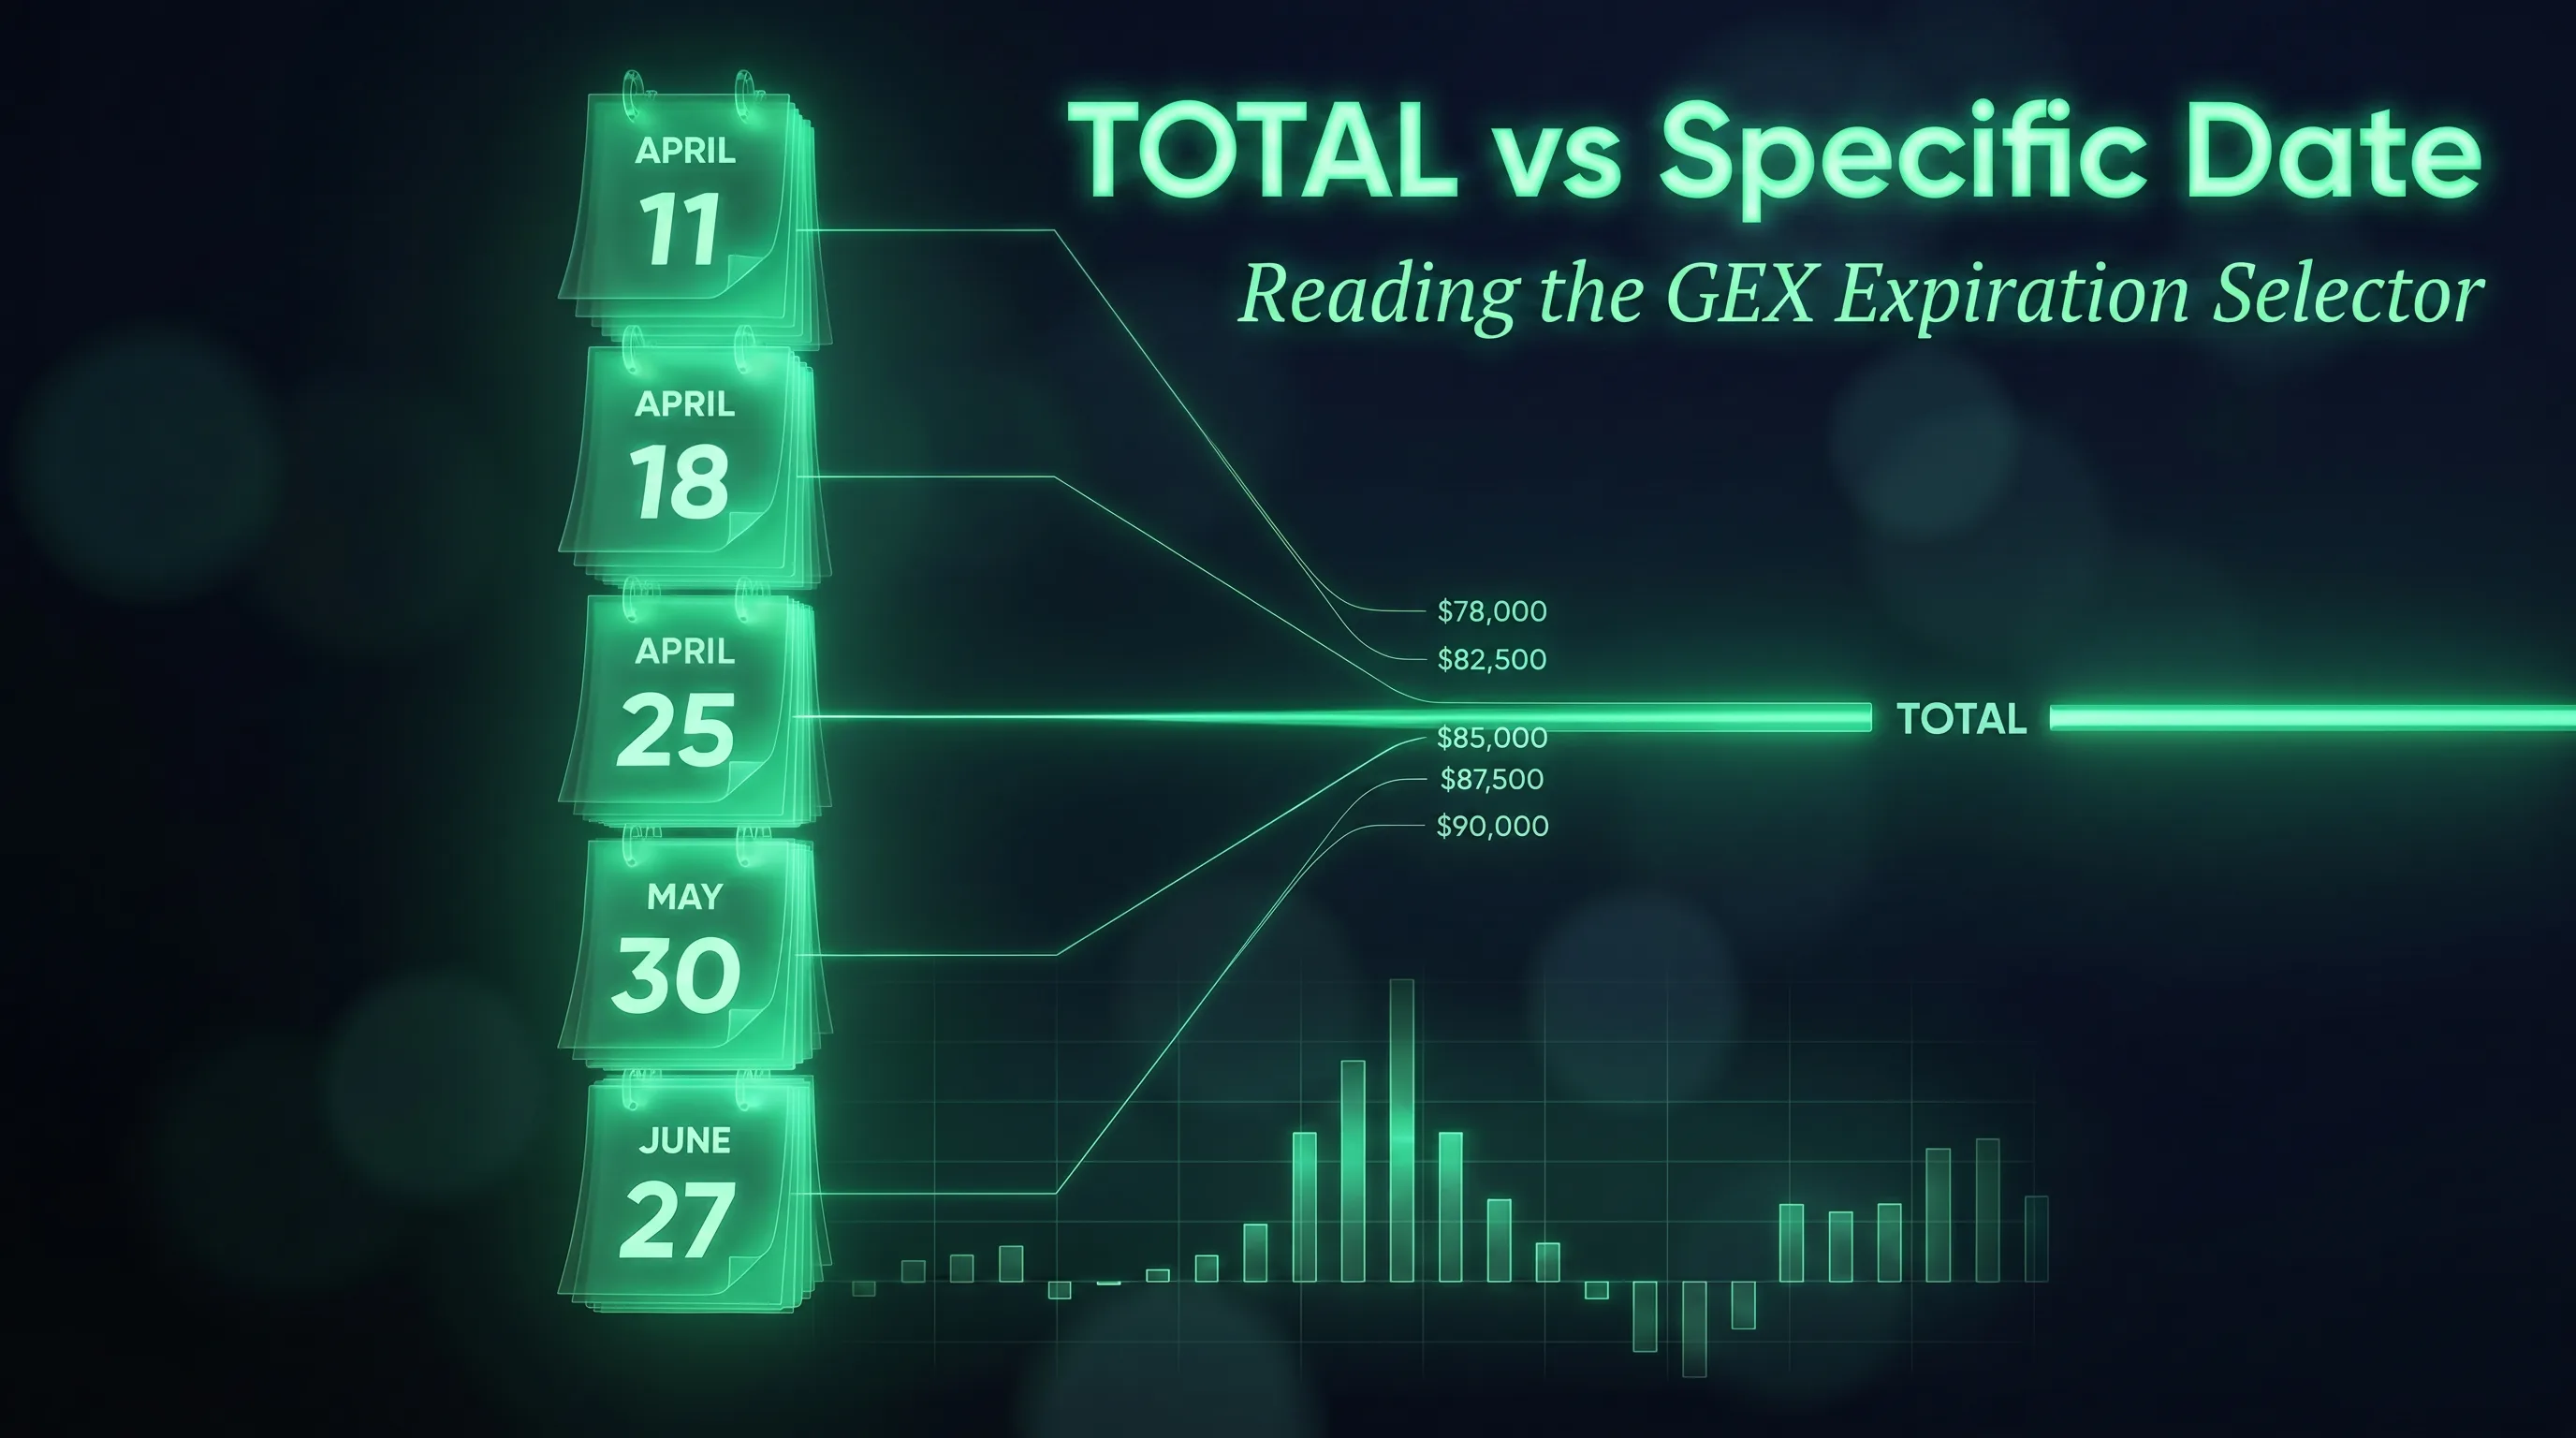
TOTAL vs Specific Date
The GEX expiration dropdown is the single most-asked-about control in the app. Here's what each setting computes, when to use which, and the diagnostic that ties them together.
A trader emails in:
"I check TOTAL. There's a wall at $80K — I'm about to short into it. I switch to next week. Now the wall is at $79K. Which one do I trust?"
Both. They're answering different questions. This is a five-minute guide to which question matches your trading style.
Strategic vs Tactical: Which Trader Are You?
Before the dropdown makes sense, you need to know which trader you are for this trade:
- Strategic — you're sizing for days or weeks. You care about where price is likely to spend time. You want the broad, slow-moving levels that survive multiple expiration cycles.
- Tactical — you're sizing for hours or a few days. You care about where price will go next, around the upcoming settlement. You want the active near-term levels.
Most traders are both, depending on the trade. Sizing a swing? Strategic. Looking for an intraday entry into a known target? Tactical. The same person, the same screen — different question, different setting.
That's exactly what the expiration dropdown switches between.
What TOTAL Actually Contains
TOTAL is a sum, not an average and not a "this month" filter.
When you select TOTAL on the GEX by Strike chart, the app aggregates gamma exposure across every expiration on the book — today's daily, tomorrow's daily, this Friday's weekly, every monthly out to the next quarterly, every quarterly out to the longest-dated tenor listed. No DTE cap, no time-weight applied on top.
That gives you the strategic view: the cross-expiration consensus. The levels you see are the ones the broader options book agrees on, smoothed across many tenors. They're slow to move because they're an average — which is exactly what you want when sizing for the next two weeks.
A specific date does the opposite. It isolates one expiration and shows only that book's structure. You see the levels that one set of hedgers — the ones defending that settlement — are actually working with. That's your tactical view.
Why the Two Views Disagree
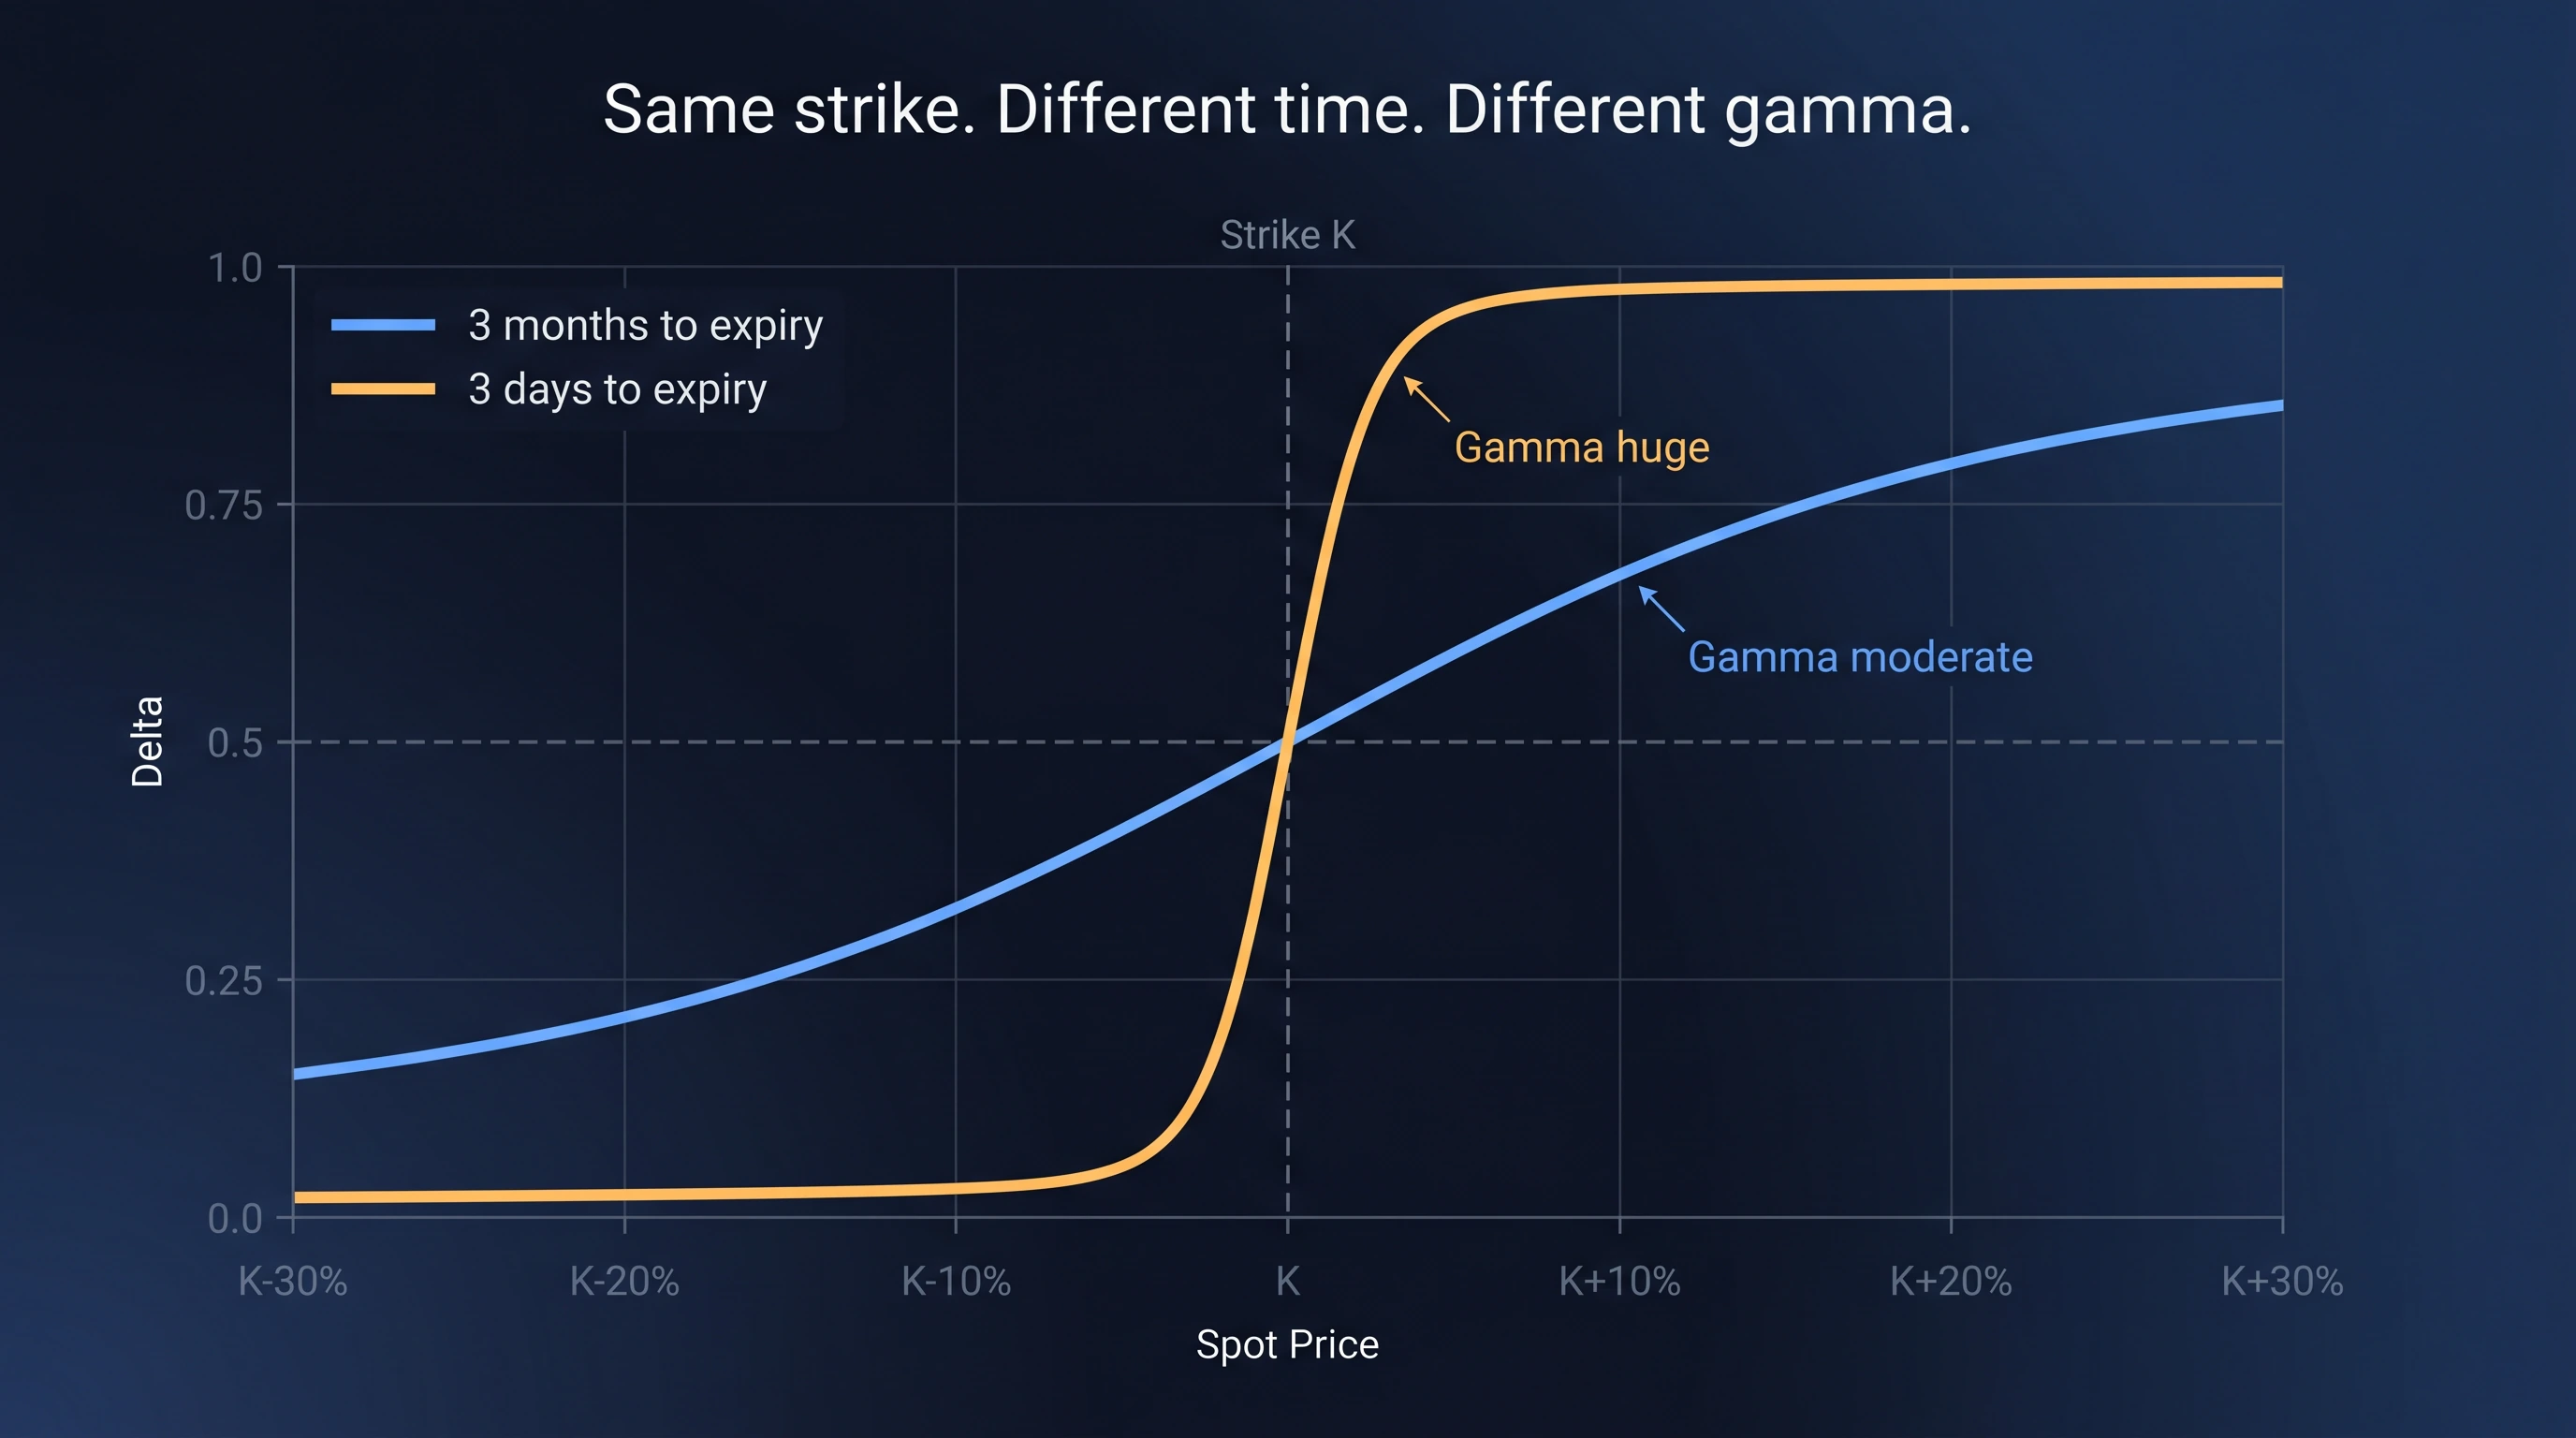
Gamma isn't distributed evenly across time.
A call expiring tomorrow and a call at the same strike expiring in nine months can show identical open interest, but they generate completely different hedging flows. Near-term, near-the-money options have the highest gamma — by a lot. Far-dated and deep-OTM contracts have gamma so small that, even with massive OI, the dealer flow they create is negligible.
So a wall on TOTAL is mostly built from the expirations doing the heaviest near-term work, with small contributions from everywhere else. Switch to a single expiration and you see only that one book's walls, undiluted. When one near-term expiration (a daily on its last day, or a weekly on Friday) is heavy enough to dominate, the two views converge. When a far-dated monthly or quarterly is the biggest contributor, they disagree by thousands of dollars.
The question is always: which expiration is currently in the driver's seat?
The Diagnostic: Term-GEX ABS
Term-GEX ABS is the chart that answers "which expiration is driving TOTAL right now?". One bar per expiration, height proportional to that expiration's absolute gamma. The tallest bar is the one in the driver's seat.
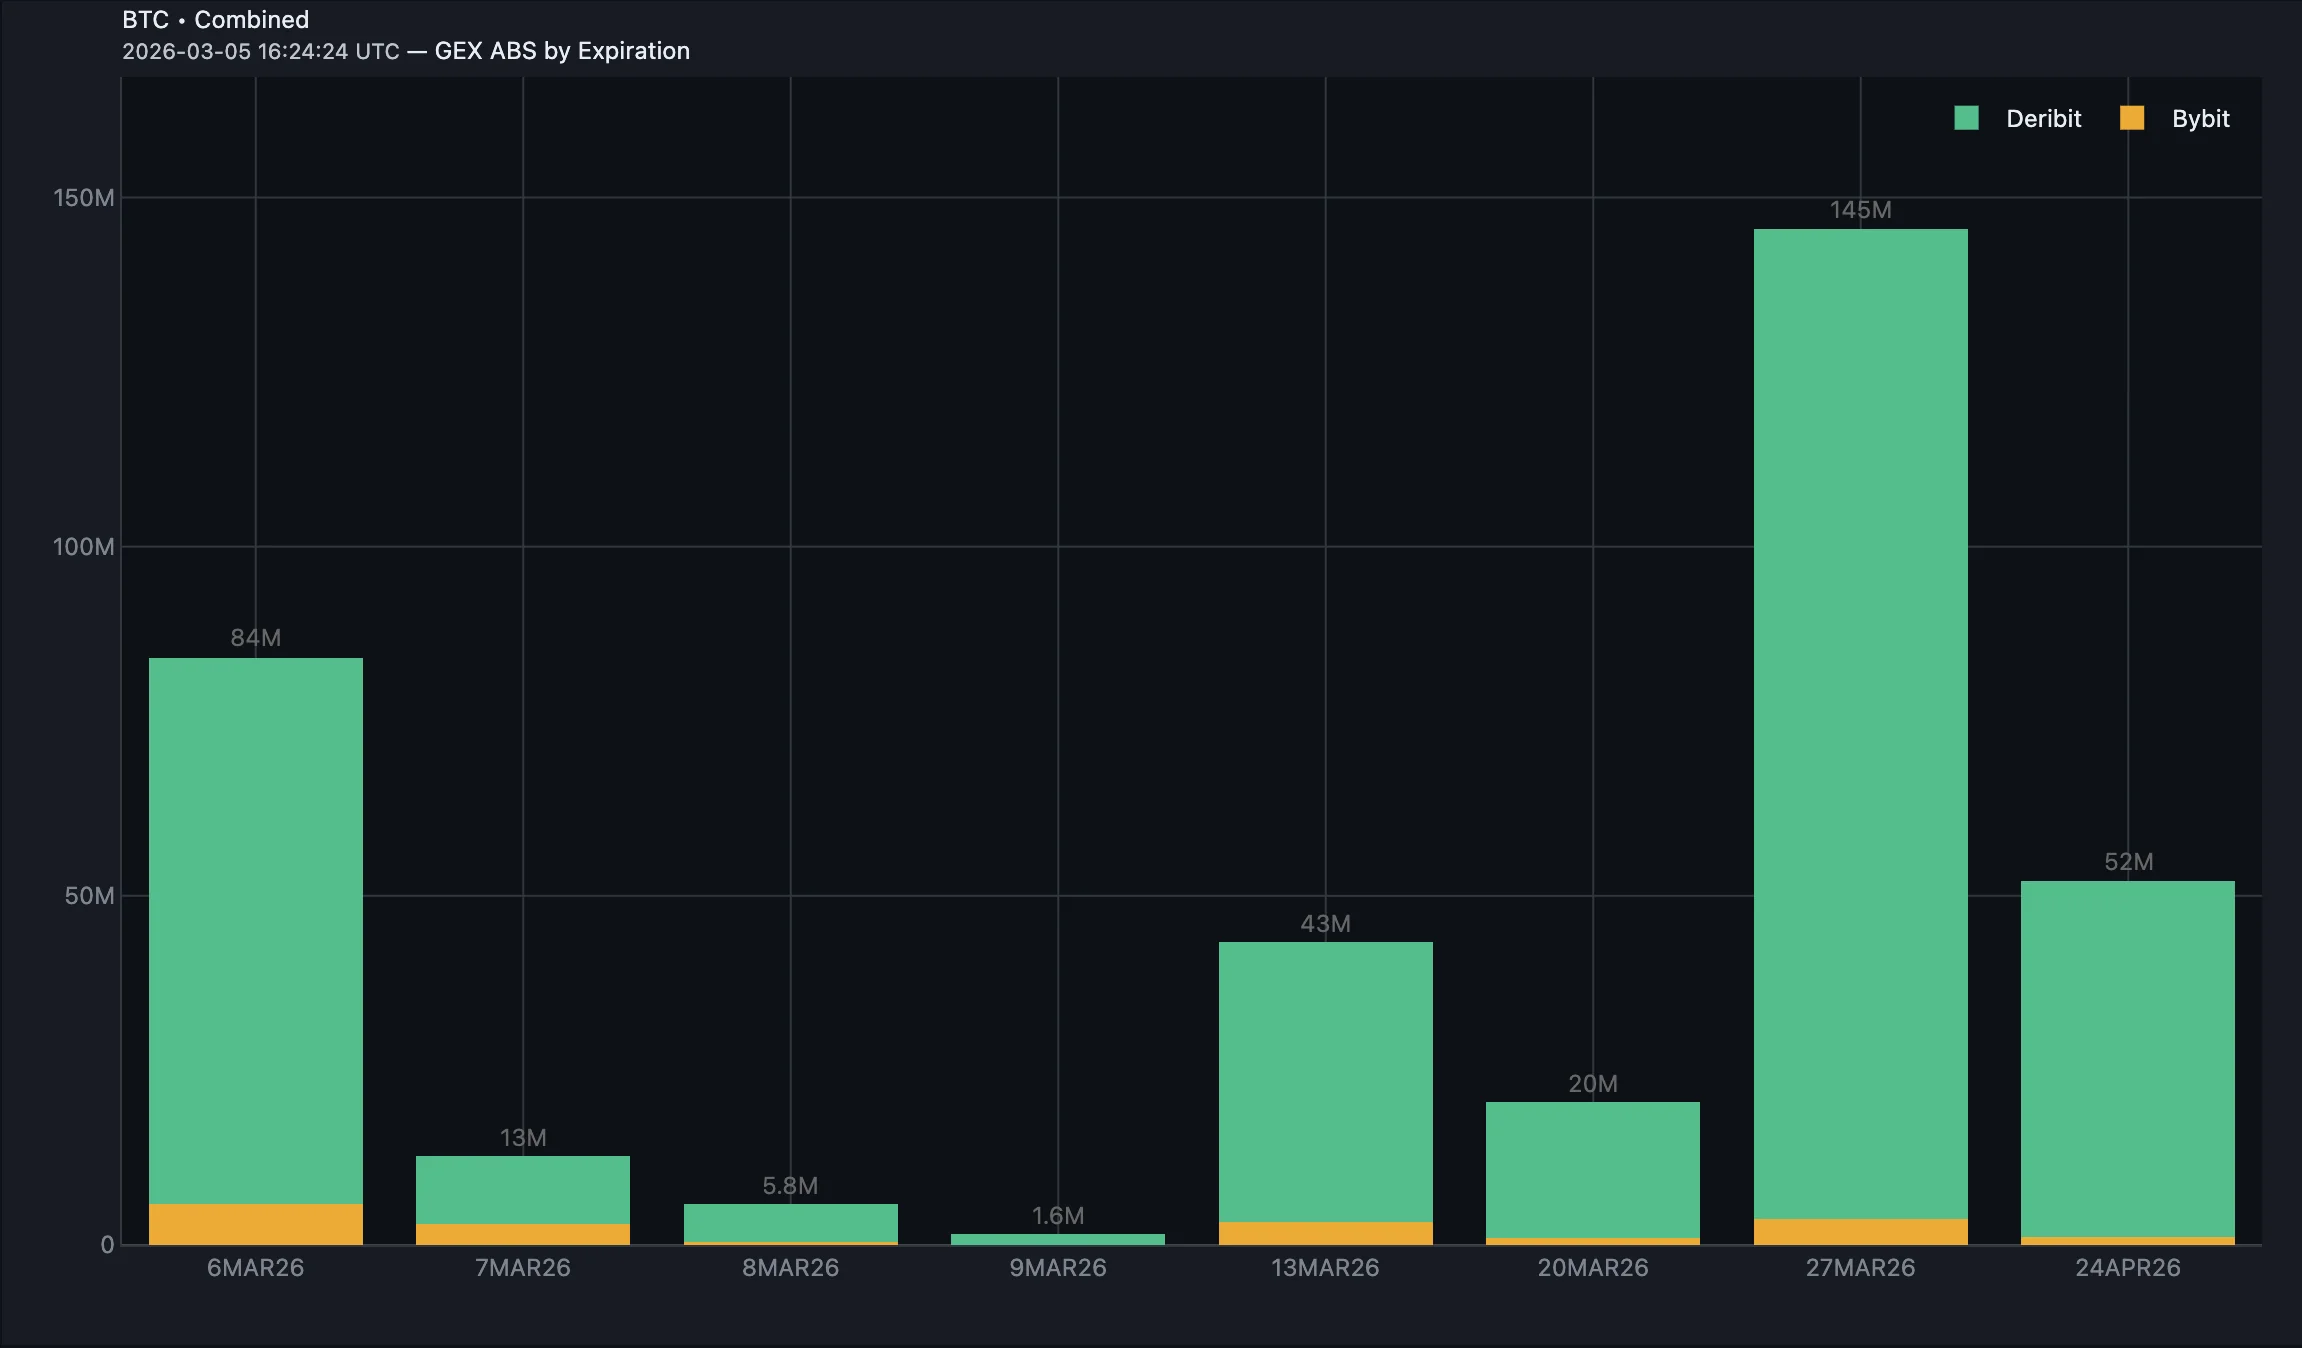
Two rules to read it:
- Tallest bar is the next-to-settle expiration (today's daily, or the upcoming Friday weekly)? TOTAL and that expiration are showing you essentially the same thing — pick either.
- Tallest bar is a monthly or quarterly weeks out? TOTAL is being pulled toward those structural levels. Near-term views will read differently — treat the two as separate signals.
That's the entire diagnostic. It takes one glance.
Worked Example: BTC, Week of Apr 13–18, 2026
Here's what disagreement looks like in real data. The week ended with the 18APR26 weekly settling on Friday at 08:00 UTC. P1 = the strongest call wall above spot.
| Date | Spot | TOTAL P1 (strategic) | 18APR26 P1 (tactical) |
|---|---|---|---|
| Mon Apr 13 | $70.9K | $80K | — |
| Tue Apr 14 | $74.4K | $76K | $75K |
| Wed Apr 15 | $74.2K | $76K | $73K |
| Thu Apr 16 | $74.7K | $76K | $73K |
| Fri Apr 17 | $75.6K | $80K | $76K |
| Fri Apr 18 (settle) | $76.2K | $80K | — |
TOTAL P1 barely moved. $80K → $76K → $80K across the week — the slow strategic ceiling. A swing trader uses this level for profit-taking on a multi-day move.
18APR26 P1 drifted with spot. Above spot, then below spot (briefly acting as support), then back above. The tactical near-term level — what a day trader uses for intraday entries and stops.
After settlement, TOTAL absorbed the next weekly without resetting — that continuity is one reason swing traders default to TOTAL.
A Reading Routine
Three steps, in order:
- Open Term-GEX ABS. This is the diagnostic. If a near-term expiration (today's daily, this Friday's weekly) is the tallest bar, you can stay on either view — they'll match. If a far-dated expiration is the tallest bar, the two views will disagree and you need both.
- Strategic levels: use TOTAL by Strike. The slow walls that survive cycles. Profit-taking zones, swing-trade targets, "where will price spend time?".
- Tactical levels: switch to the dominant expiration. The near-term ceiling, floor, and flip-regime boundary (the price where dealer hedging changes direction). Use these for entries, stops, and intraday pin zones.
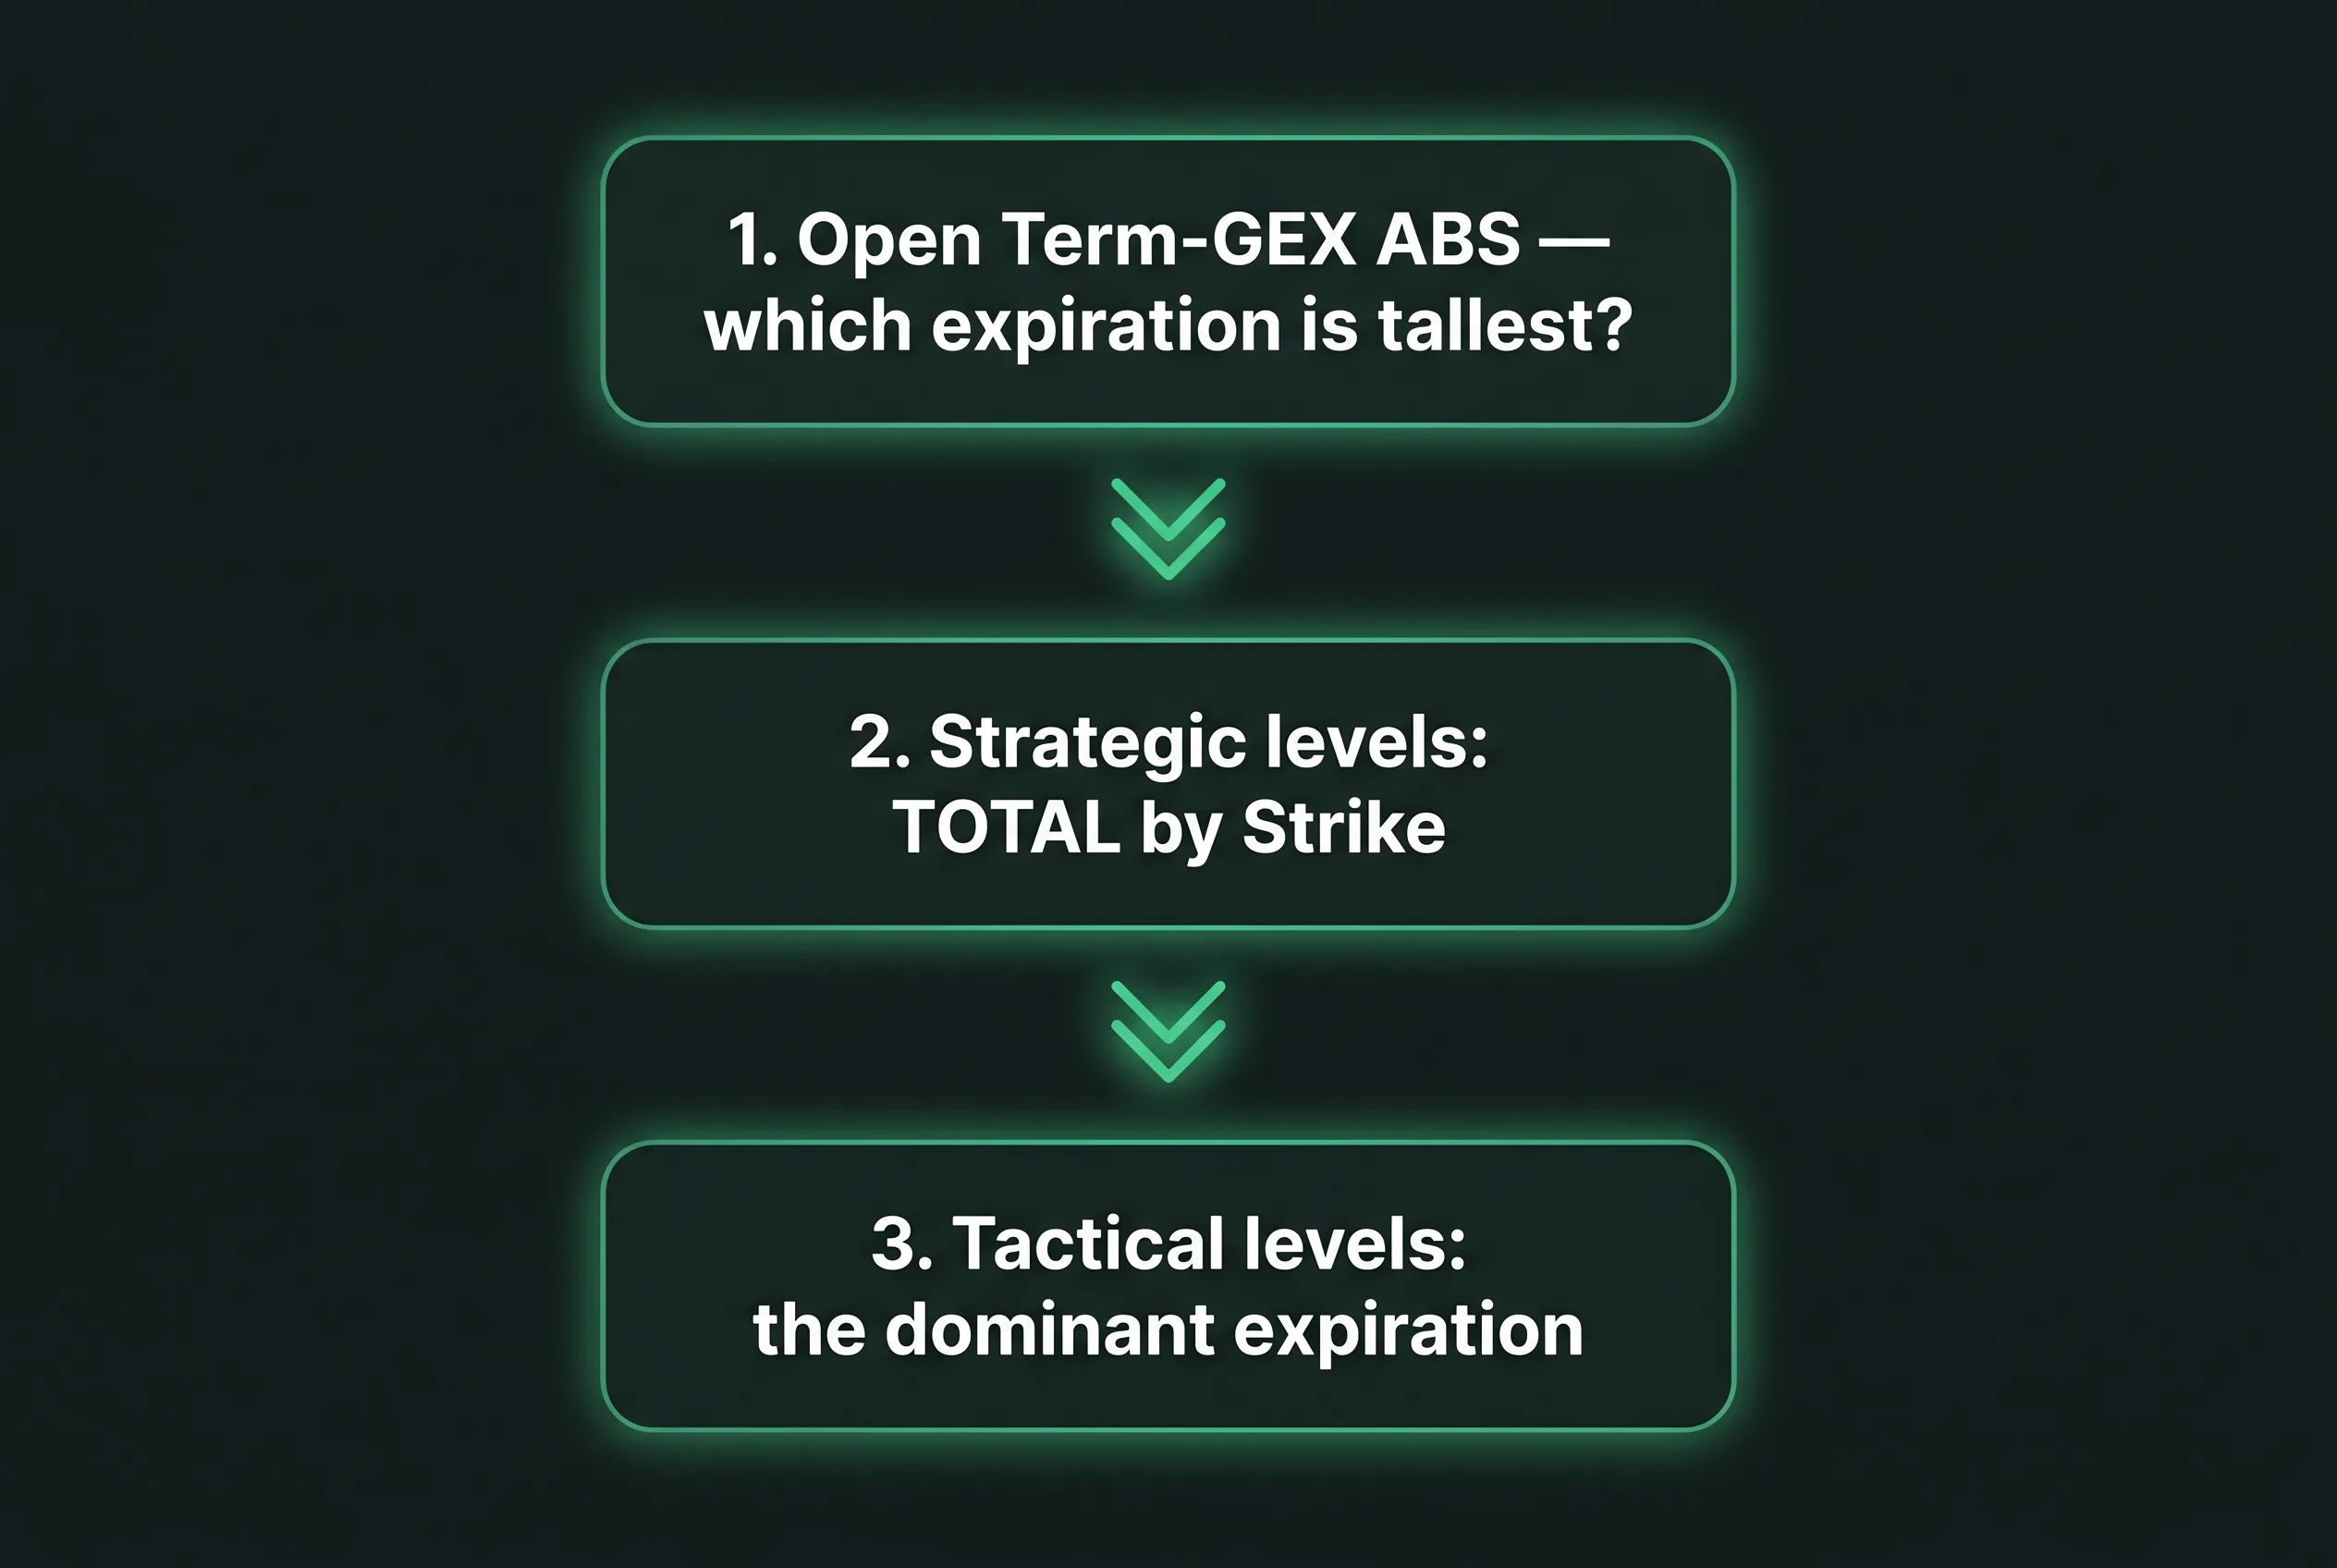
The shortcut. When the tallest bar in Term-GEX is the next-to-settle expiration — which is common in the final hours before any settlement, daily or weekly — TOTAL automatically ≈ that expiration. You can skip steps 2 and 3 and just trade off the dominant book.
"Is TOTAL Enough if I'm Not a Day Trader?"
For most swing traders, yes. TOTAL gives you the strategic levels you actually trade off — slow, structural, surviving cycles. You don't need to think about the dropdown most of the time.
The one caveat is the pre-settlement window — the final hours before whatever's about to settle (daily, weekly, or monthly). Gamma collapses onto that near-term book and occasionally surfaces an intraday pin zone worth knowing about, even if you're not trading it intraday. Glance at the next-to-settle expiration then. Outside that window, TOTAL is fine on its own.
Key Takeaways
- TOTAL is the strategic view — every expiration summed. Use it for swing-trade levels that survive multiple cycles.
- A specific date is the tactical view — one book in isolation. Use it for near-term entries, stops, and the active gamma regime.
- Term-GEX ABS is the diagnostic — the tallest bar tells you which expiration is driving TOTAL, and therefore whether the two views agree.
TOTAL shows you the consensus level. The dominant expiration shows you where price is actually leaning today.
For the gamma-walls reframe of the TOTAL trap, see Max Pain vs Flip Point. For the full Term chart suite, see Term Metrics Beyond Open Interest. For how the heatmap (always TOTAL) and the Friday cycle fit in, see the heatmap lesson and the Friday reset.
Info
Disclaimer: This article is for educational purposes only. GEX metrics describe market structure — they are not price predictions. Past patterns do not guarantee future results. Always use proper risk management and consider multiple data sources before making trading decisions.
Ready to see GEX in action?
Try GammaFlip.io and experience professional-grade gamma exposure analysis
Open Dashboard