
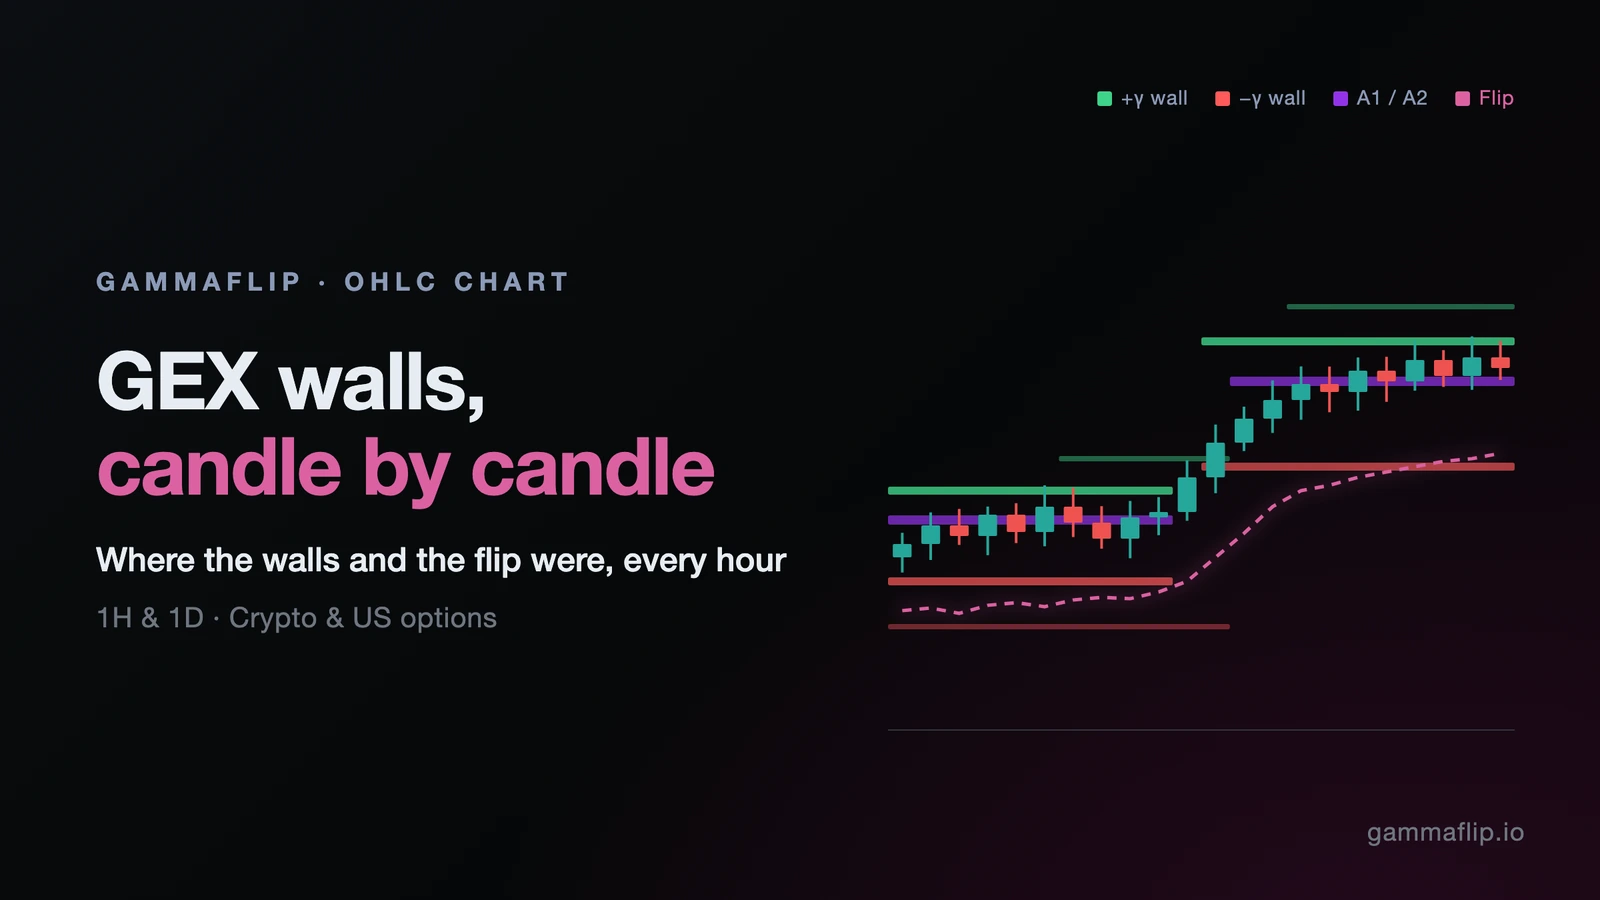
GEX Wall History on the Candle Chart
The Day and Hour candle charts now show where the gamma walls, the flip and the A1/A2 magnets stood at every candle, not only where they are right now.
Until today, the levels on the candle chart were a snapshot. You saw the current P1, N1, A1 and flip drawn across the whole chart, including over candles that traded weeks before those levels existed. That made a simple question hard to answer: was this wall actually there when price bounced off it?
Now every candle carries its own levels. Green and red bars mark the strongest positive and negative gamma walls of that candle, purple bars mark the two biggest absolute-gamma strikes (A1/A2), and a dashed magenta line traces the gamma flip through time.
What You See on the Chart
Open Now → Day or Now → Hour. The overlay is on by default.
- Green bars: +γ walls. For every candle we take the strikes with the strongest positive net GEX, averaged over all the snapshots inside that candle, and draw the top two. The thicker bar is the strongest, the thinner one second. Positive gamma is where dealer hedging tends to sell rallies and buy dips, so these levels tend to slow price down.
- Red bars: −γ walls. The same for negative net GEX. Here dealer hedging goes with the move, so price can travel faster through these zones.
- Purple bars: A1 and A2. The two strikes with the largest absolute gamma (|call GEX| + |put GEX|), averaged over the candle. They show where most of the options book sits, whatever its sign: the strikes price often gravitates to and pins around. A1 is the thicker bar.
- Dashed magenta line: the gamma flip. The price where net GEX changes sign, averaged over the candle. Above it dealers are net long gamma (moves tend to dampen); below it they are net short gamma (moves tend to extend).
- Brightness follows strength. A faint bar is a wall that barely made the cut; a bright one is among the strongest in the window you are looking at.
The current levels are still there: they now sit as short stubs between the last candle and the price scale, with their labels (P1, N1, A1, F …), so they no longer cover the history.
The four chips under the chart, Positive, Negative, Absolute and Regime, switch both the current levels and their history: turn off Negative and the red walls disappear along with N1/N2.
The Controls
Open the chart controls (the sliders icon at the top right of the chart).
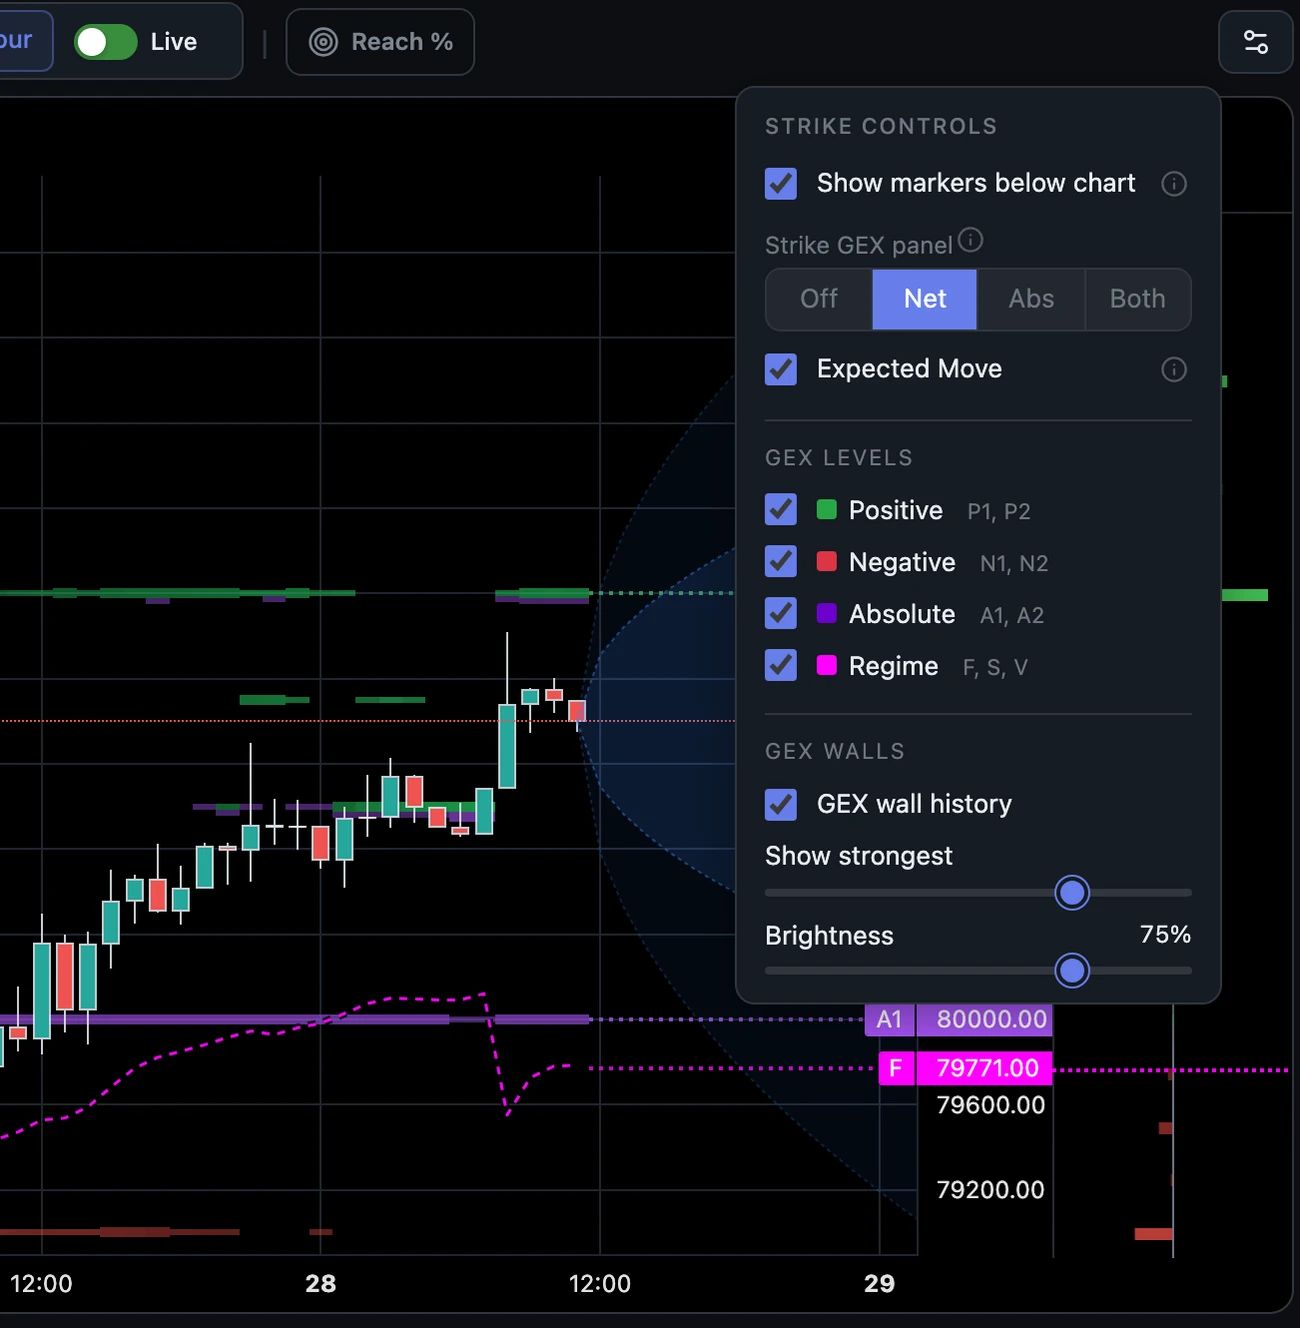
- GEX wall history turns the overlay on or off.
- Show strongest decides how many of the walls you see. At 100 % every candle shows its two strongest walls on each side; lower it and only the strongest walls in the window stay. The same share applies to the A1/A2 bars. The default (75 %) hides the weakest quarter, which is where most of the noise is.
- Brightness sets how bold the bars are, so you can keep the candles readable.
- Candle borders (in Settings → Chart) outlines the candles while the overlay is on, so they stay sharp over the bars.
How to Read It: Three Examples
1. Was the wall really there? (BTC, 1H)
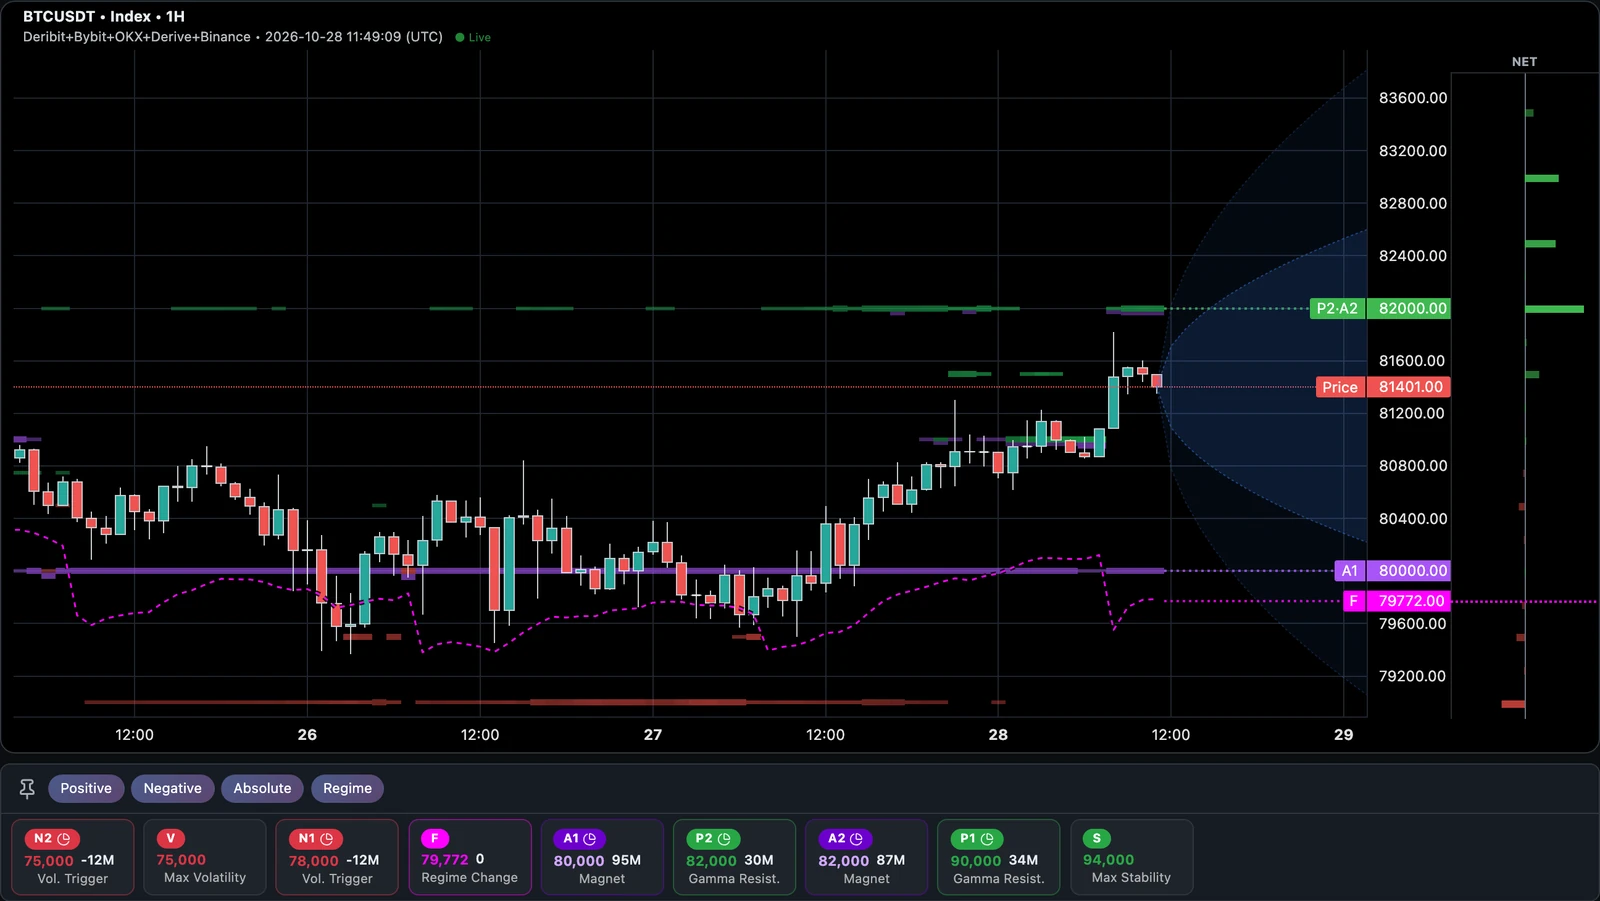
The chart at the top shows BTC on all five exchanges, 25–28 October. Three things stand out:
- A1 stayed at 80,000 for the whole window. That is the thick purple bar. Twice, on the 26th and the 27th, price slipped to it and was bought back.
- The flip sat just under it, between ~79,400 and ~80,300. So each dip to 80,000 was also a test of the regime line. As long as price held above it, dealers were long gamma and the dips were absorbed.
- 82,000 was a +γ wall and A2 at the same time (the green bar with purple under it, labelled P2·A2 on the right). When BTC rallied on the 28th it stopped a few hundred dollars short of it.
With a snapshot alone you would see "A1 80,000, flip 79,771" today. With the history you can see the level was there before each bounce, not drawn after it.
2. The walls move with the market (BTC, 1D)
The daily view is where you watch dealers reposition.
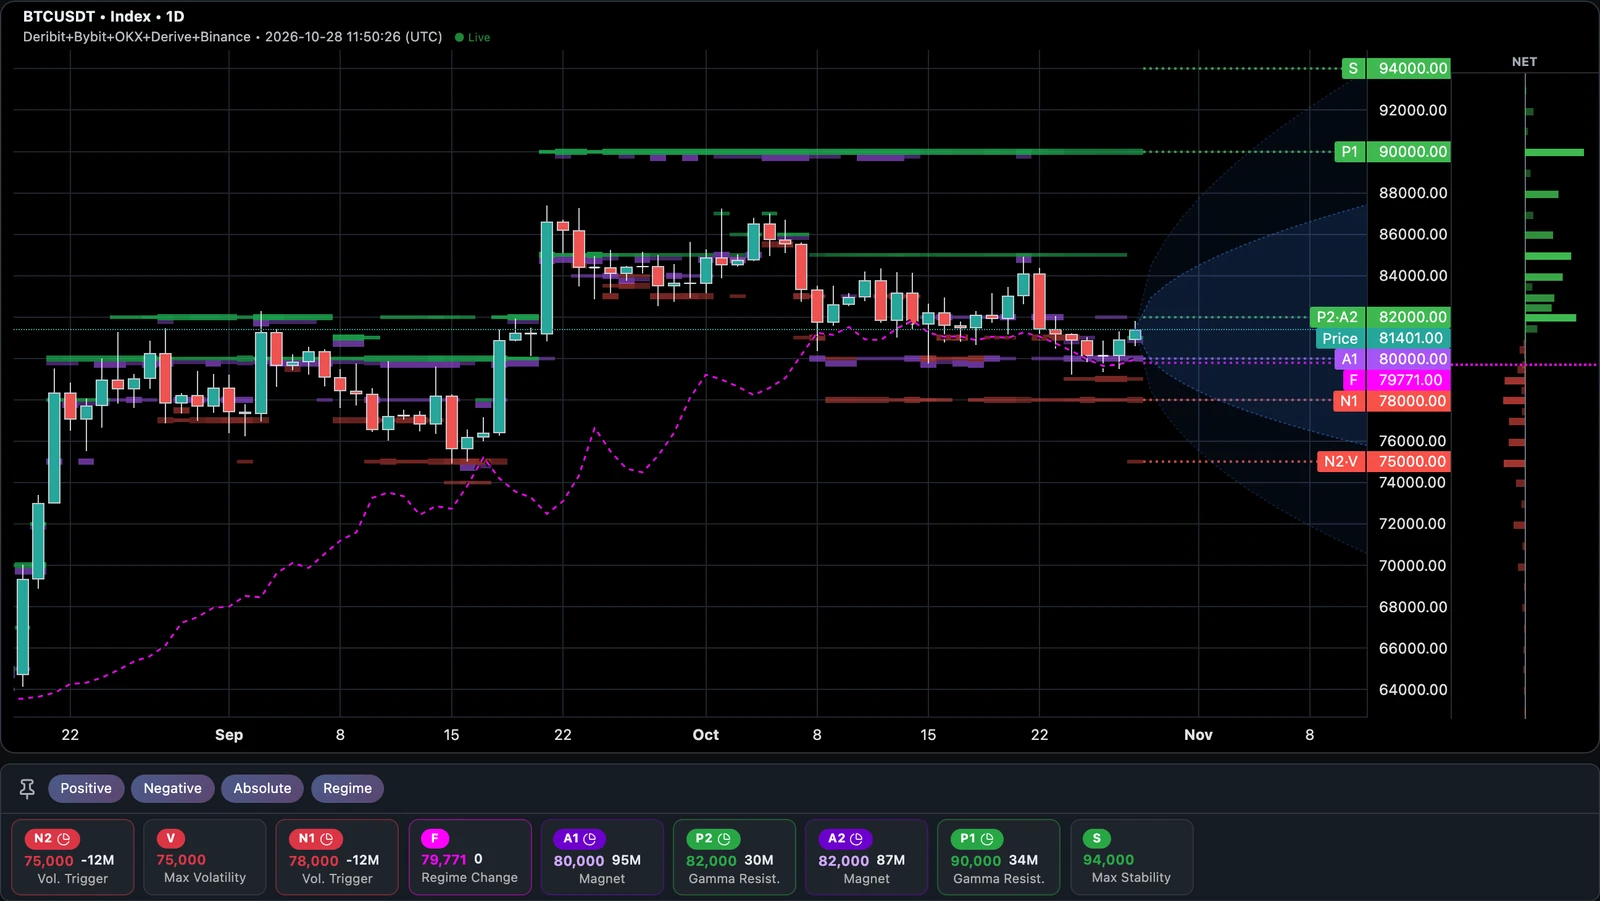
- Late August to mid-September: A1/A2 sat at 78,000–80,000 while BTC ranged around them.
- After the 21 September breakout above 85,000 the walls followed. Within days A1/A2 moved to 84,000–85,000 and 90,000, and a long +γ wall at 90,000 sat above the move for weeks; BTC never got there.
- The flip lagged far behind. It was near 64,000 in late August, about 73,000 by mid-September and only caught up with price, around 81,000, in October.
- In October, as BTC slid back, A1/A2 returned to 80,000/82,000. Price is now sitting on that same zone, with the flip right underneath.
Walls are not fixed lines. When price makes a big move, new open interest builds at new strikes, and the old walls fade. A wall that has followed price for weeks is a different signal from one that appeared yesterday.
3. Regime first, then levels (SPY, 1H)
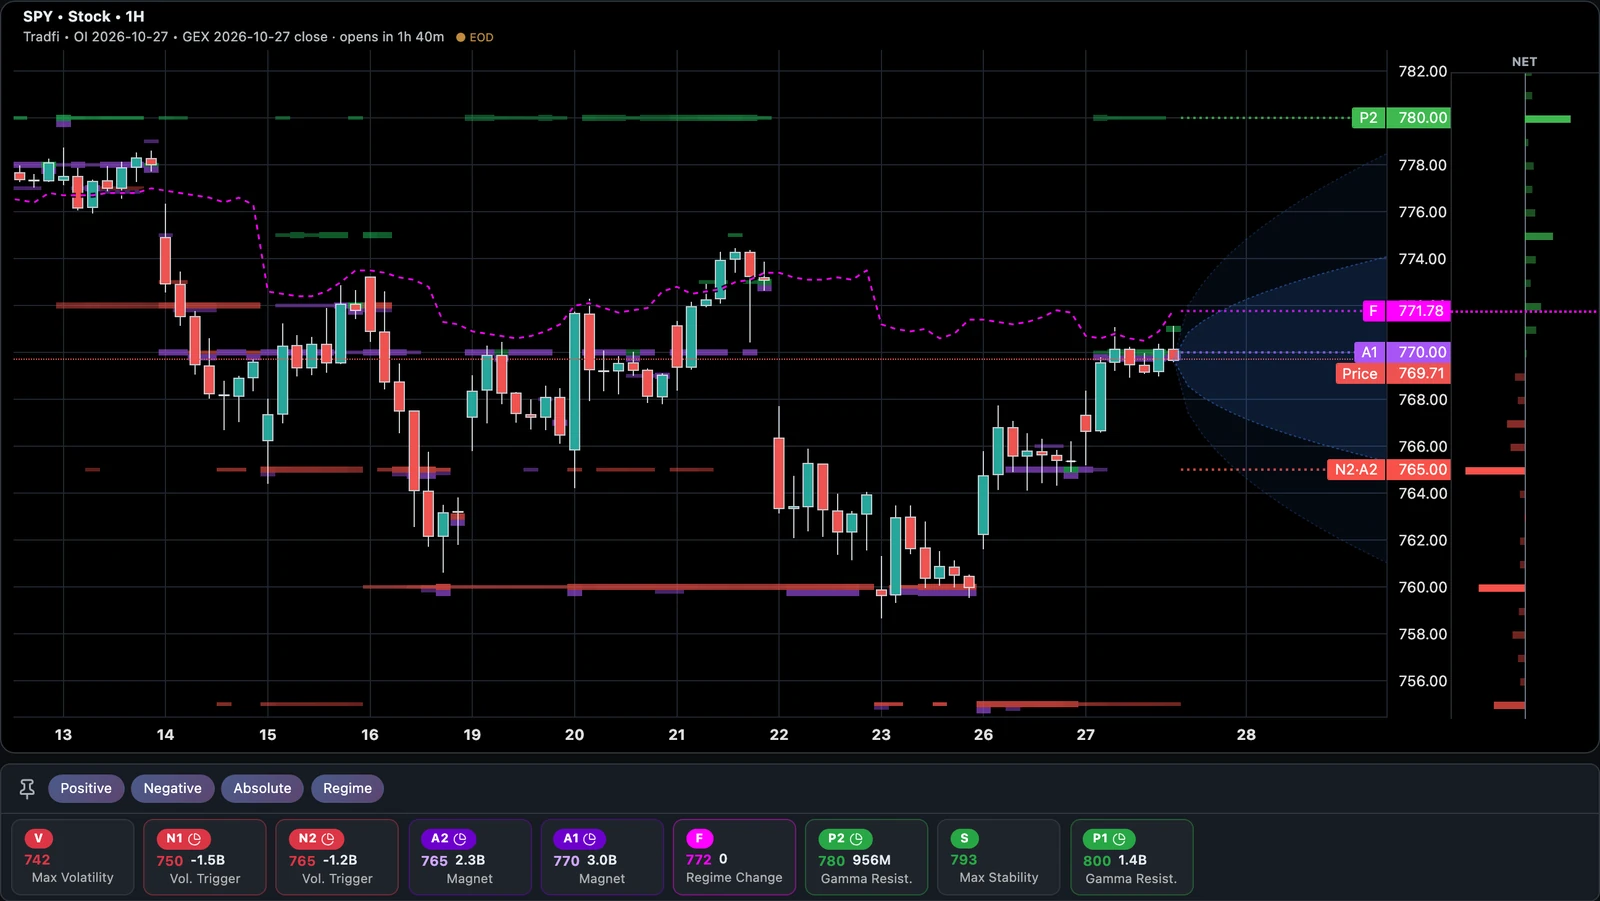
SPY spent most of the second half of October below its flip (the magenta line at roughly 770–777). Below the flip, dealers hedge with the move, and the chart shows it: the drops on the 16th and the 22nd were fast and deep.
The history also shows where the selling ran out. On the 22nd, A1 moved down from 770 to 760, with a −γ wall at the same strike. SPY made its low there on the 23rd, held it, and as price recovered A1 moved back to 765 and then 770. Right now SPY trades just under the flip again, with A1 at 770.
The same overlay works for every US name we cover (SPY, QQQ, IWM, SPX and the others) on the same OPRA-based US options data as the rest of the TradFi charts.
Practical Uses
- Levels with a timestamp. Walls are where price tends to stall or speed up, not lines it must respect. Before you lean on one, look left: has it been there for many candles, or did it just appear?
- Know the regime you are in. How long has price been above or below the flip? A market that keeps hugging the flip behaves differently from one that sits far above it.
- Follow the walls after a breakout. If walls roll up behind price, positioning is moving with it. If price runs away from the walls and they stay put, the move has nothing under it.
- Check A1/A2 for pins. When the same strike stays A1 for days, price often keeps coming back to it, especially into expiry.
Details and Limits
- Hour and Day views. 1H shows up to 45 days of candles, 1D up to 600 days. Our history goes back to February 2026 on the longest-running markets; coins and exchanges added later start on the day we added them (HYPE in September, Derive on 28 September, Binance on 13 October).
- Exchanges. Works on a single exchange, on All, and on any mix you pick (for example Deribit + Binance). For a mix, the flip line starts on 29 September 2026; walls and A1/A2 are drawn for the whole history.
- Averages per candle. Every bar is the average over the snapshots inside that candle, so a level that flickered for five minutes won't dominate a daily candle. The last candle updates as new data arrives.
- Not in replay. The overlay is hidden in Time Machine replay.
- Plans. Available on every plan and trial in the app; US names need a plan with TradFi. It is not part of the API or the Claude / ChatGPT connector yet.
GEX is built from open interest and assumptions about who holds it. Walls tell you where hedging flows are likely to be large, not that price must stop there. Use them together with the regime, not on their own.
Open GEX Studio, pick Day or Hour, and scroll back through the walls.
Ready to see GEX in action?
Try GammaFlip.io and experience professional-grade gamma exposure analysis
Open Dashboard