
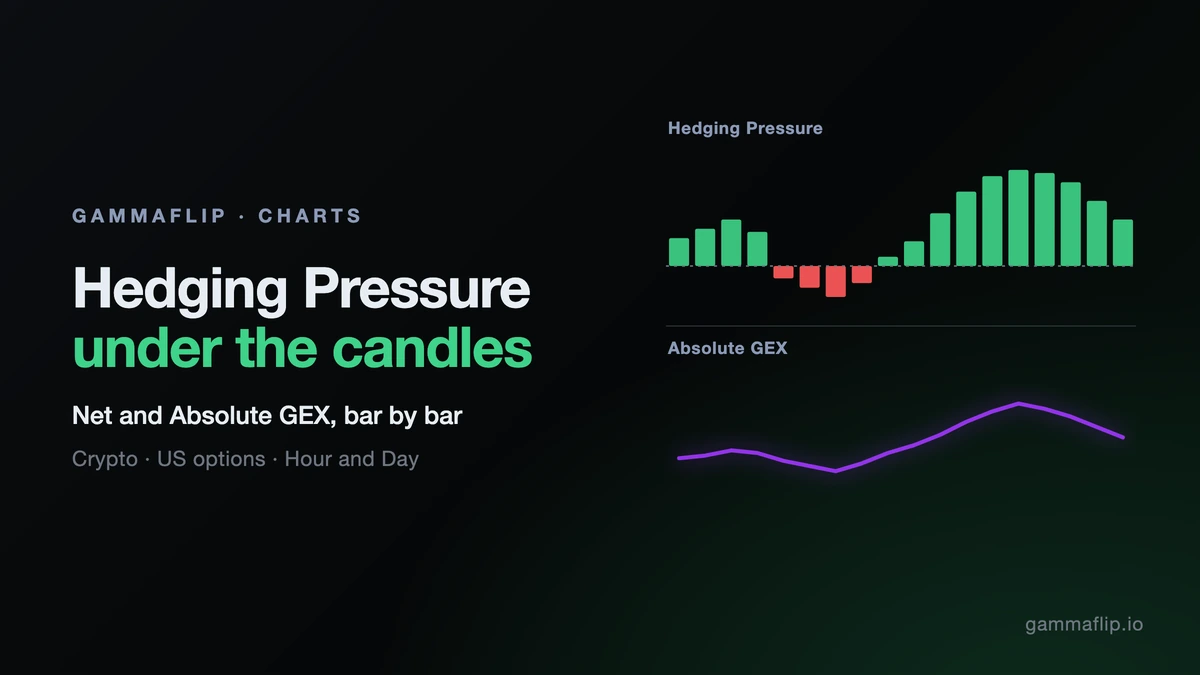
Hedging Pressure and Absolute GEX Under the Candles
The Hour and Day charts now show the dealer regime under every candle. It tells you how much price may move. It doesn't tell you which way.
Until now, Net and Absolute GEX over time lived in the side rail of the strike chart, and only for the last day. To compare them with price you had to flip between views. Now both sit under the candles, on the same time axis, as far back as the history goes.
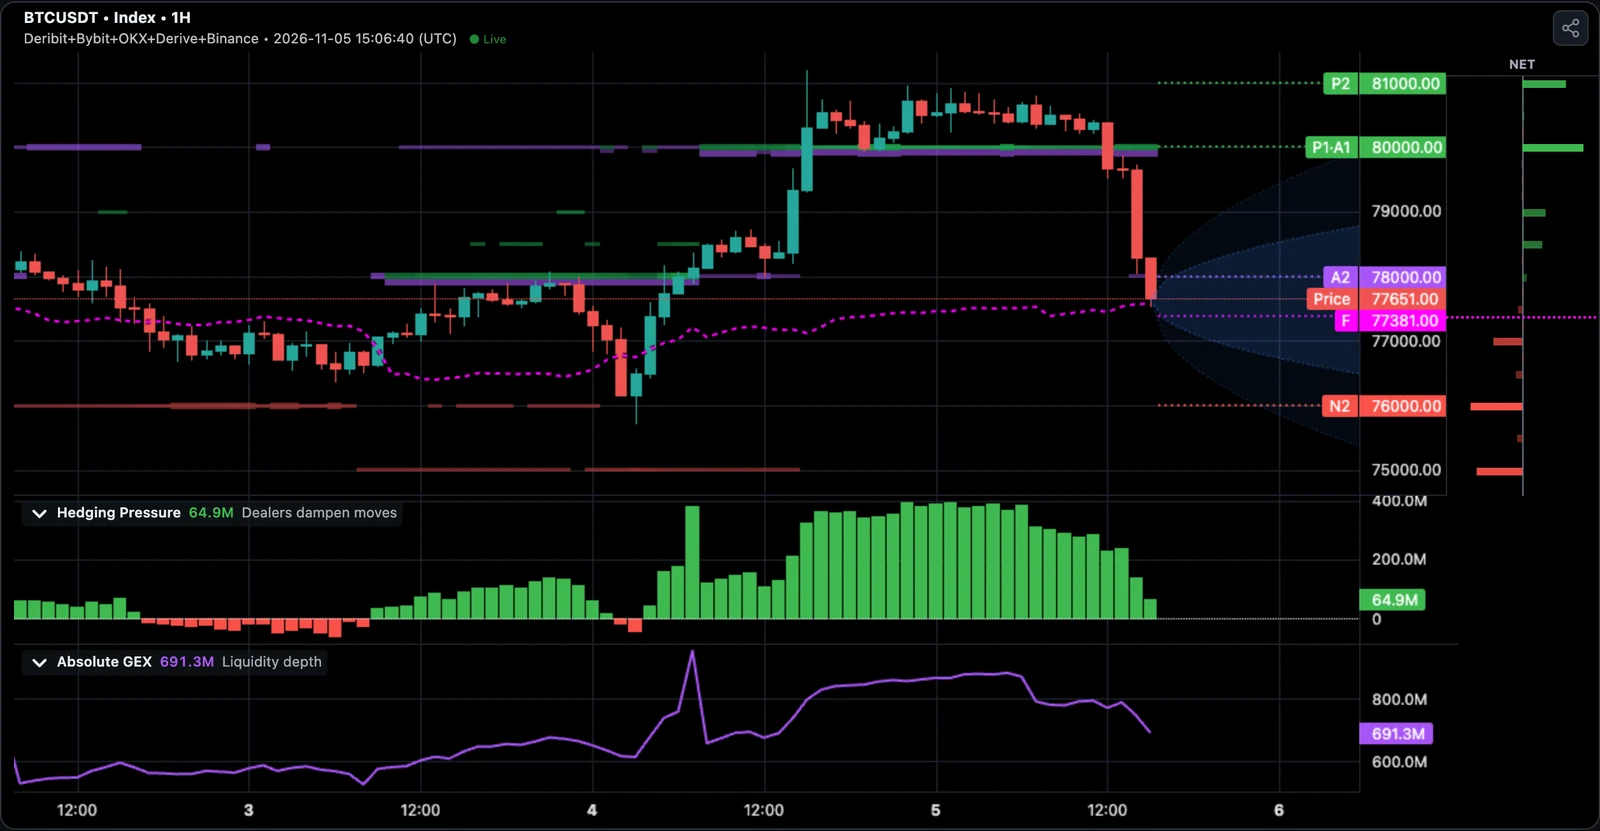
What the Two Panels Show
Hedging Pressure is Net GEX. When it is positive, dealers are net long gamma: they tend to sell into rises and buy into dips, which dampens moves. When it is negative, they are net short gamma and their hedging goes with the move, which amplifies it. The bars are green above zero and red below.
Absolute GEX adds up gamma of both signs. Think of it as how much options positioning stands behind the market, whichever way it leans. We call it liquidity depth.
Each closed bar shows the last capture inside that bar. The newest bar updates about once a minute with the live value.
What the Data Says
We checked this on BTC across all exchanges, from 1 May to 5 November 2026, using a capture every 15 minutes. For each capture we measured the price range over the next 4 hours.
| Hedging Pressure | Share of time | Median range, next 4 h | Median range, next 24 h |
|---|---|---|---|
| Positive | 82% | 0.62% | 2.03% |
| Negative | 18% | 0.96% | 2.83% |
So BTC travelled about 1.5 times further when the bar was red. Volatility clusters, so a fair question is whether this only repeats recent volatility. We split the sample by the range of the previous 4 hours, and the gap stayed:
| Previous 4 h were | Next 4 h, Net positive | Next 4 h, Net negative |
|---|---|---|
| Calm | 0.46% | 0.71% |
| Average | 0.65% | 0.75% |
| Wild | 0.75% | 1.14% |
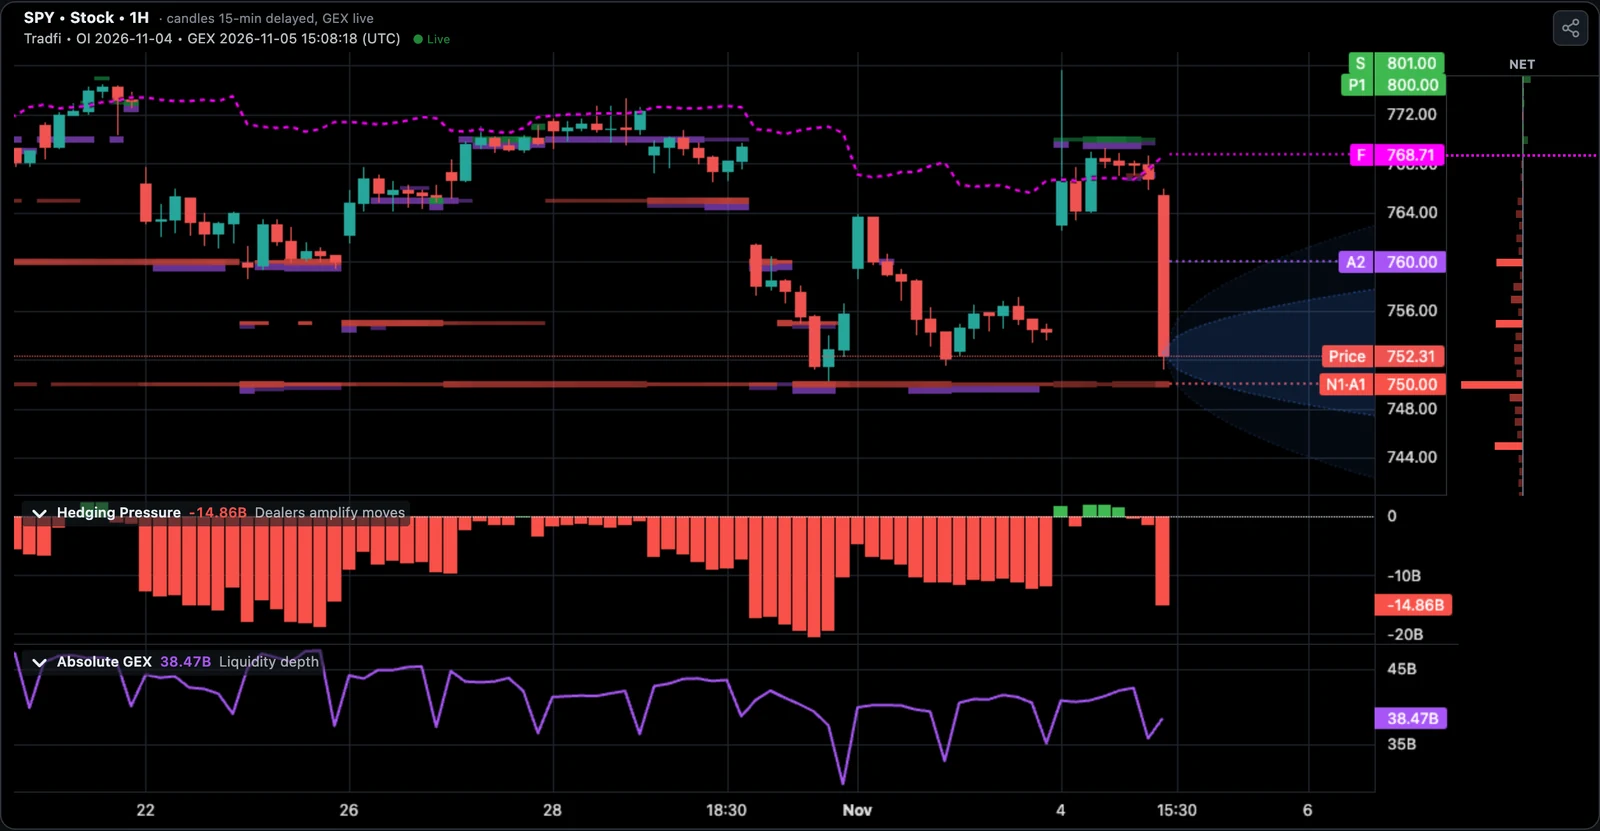
SPY shows the same pattern: 0.12% against 0.18% over the next hour. It also spends much more time negative, with Net positive only 41% of the time.
ETH is weaker: 0.85% against 0.92%, and in average conditions the gap disappears. Don't assume one coin's reading carries over to another.
What It Doesn't Say
Direction. Over 4 hours BTC rose 53% of the time when Net was positive and 47% when it was negative, but the average returns (+0.02% and −0.10%) are both within their margin of error of zero. A red bar is not a short signal, and a green bar is not a long signal. On 5 November, for example, BTC fell from about $80,000 to about $77,600 while Hedging Pressure stayed green.
This matches our earlier research on the gamma flip over the same kind of BTC data: GEX says far more about how far the market may go than about where it goes.
These numbers cover about six months of one market regime. Ranges are measured from 15-minute captures, so true highs and lows would be somewhat wider. Treat them as a guide to the effect, not a forecast.
How to Use the Panels
Size for the regime. When Hedging Pressure turns and stays red, expect wider swings: tighter size or wider stops can make more sense than the same trade in a green regime. This is where the data is strongest.
Look for persistence, not one bar. On BTC, half of the negative stretches ended within about 40 minutes, while the longest tenth lasted 15 hours or more. A single dip below zero says little. We haven't tested a rule for how long is long enough, so this is a reason for caution, not a trigger.
Read Absolute GEX as context. On its own it says less. When it was low against its own past month, the next 4 hours were wider by about 10% on BTC and 20% on ETH, with no difference over 24 hours. It helps most with red bars: Net negative with low Absolute GEX had a median 4-hour range of 1.05%, the widest group we measured.
Expect steps that aren't news. Absolute GEX can drop sharply around the daily 08:00 UTC expiry: in about one in ten of those readings it fell by 17% or more within 15 minutes. It can also step when an exchange joins the total, as Derive did on 28 September and Binance on 13 October. A step like that may be a change in what is being counted, not a shift in the market.
Controls
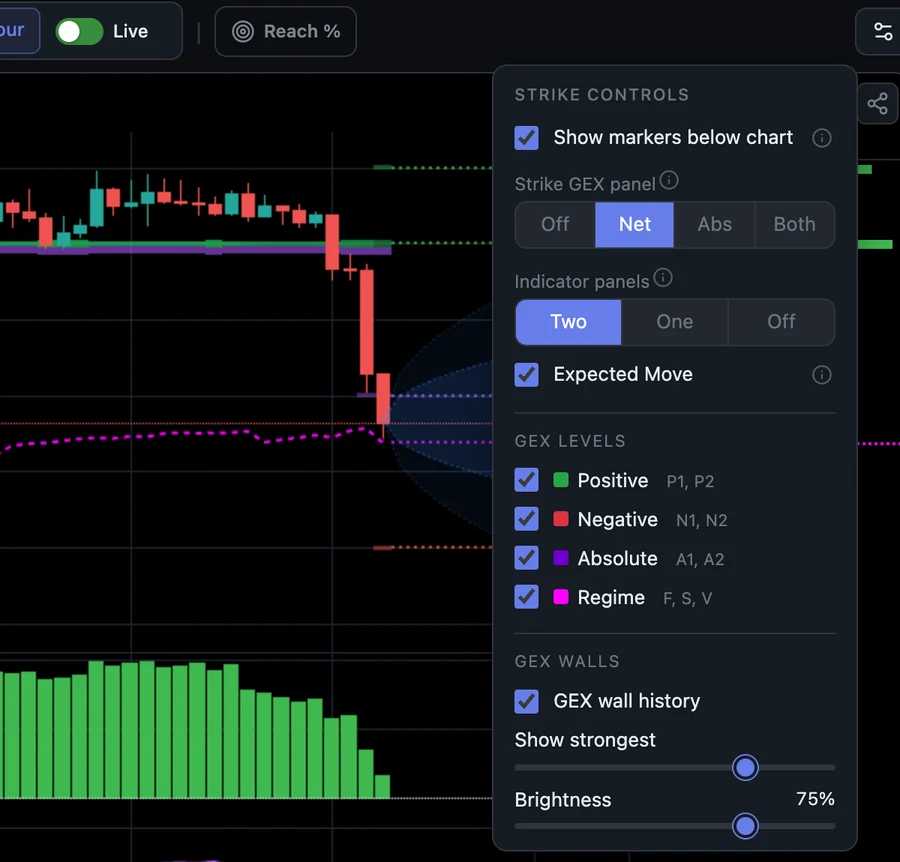
- Two, One or Off: in chart controls, under Indicator panels. One puts both on one panel with separate scales, so ignore where the line sits against the zero line.
- Resize and collapse: drag the line between panels, or click the arrow to fold one into a strip that still shows its value. Your layout survives a reload.
- Your exchanges: the panels follow your selection, including mixes like Deribit + OKX.
- Replay: in the Time Machine they show only what was known at that moment.
- Share: a button in the Share dialog adds the panels you have open to the card. It is off by default.
One limit to know: the panels always show all expiries. If you pick one expiry, the levels on the chart follow it but the panels don't, and the legend says so, for example TOTAL, not 6NOV26. That's why the side rail can show a different number at that moment.
Try It
Open BTC on the Hour chart, or SPY for US options. Hedging Pressure is on by default, and Absolute GEX starts collapsed: click its arrow to open it.
This article is for education only and is not investment advice.
Ready to see GEX in action?
Try GammaFlip.io and experience professional-grade gamma exposure analysis
Open Dashboard